Showing posts with label tutorial. Show all posts

Friday, April 11, 2014

Clojure Koans

In an attempt to reach a bit higher plane of enlightenment with respect to Clojure, I did the Clojure Koans. What a great way to get familiar with a new language.

It might be worth watching the video solutions: Clojure Koans Walkthrough in Light Table.

Friday, June 24, 2011

Drawing heatmaps in R

A while back, while reading chapter 4 of Using R for Introductory Statistics, I fooled around with the mtcars dataset giving mechanical and performance properties of cars from the early 70's. Let's plot this data as a hierarchically clustered heatmap.

# scale data to mean=0, sd=1 and convert to matrix
mtscaled <- as.matrix(scale(mtcars))

# create heatmap and don't reorder columns
heatmap(mtscaled, Colv=F, scale='none')

By default, heatmap clusters by both rows and columns. It then reorders the resulting dendrograms according to mean. Setting Colv to false tells it not to reorder the columns, which will come in handy later. Let's also turn off the default scaling across rows. We've already scaled across columns, which is the sensible thing to do in this case.

If our columns are already in some special order, say as a time-series or by increasing dosage, we might want to cluster only rows. We could do that by setting the Colv argument to NA. One thing that clustering the columns tells us in this case is that some information is highly correlated, bordering on redundant. For example, displacement, horsepower and number of cylinders are quit similar. And the idea that to get more power (hp) and go faster (qsec) we need to burn more gas (mpg) is pretty well supported.

Separating clusters

If we'd like to separate out the clusters, I'm not sure of the best approach. One way is to use hclust and cutree, which allows you to specify k, the number of clusters you want. Don't forget that hclust requires a distance matrix as input.

# cluster rows
hc.rows <- hclust(dist(mtscaled))
plot(hc.rows)

# transpose the matrix and cluster columns
hc.cols <- hclust(dist(t(mtscaled)))

# draw heatmap for first cluster
heatmap(mtscaled[cutree(hc.rows,k=2)==1,], Colv=as.dendrogram(hc.cols), scale='none')

# draw heatmap for second cluster
heatmap(mtscaled[cutree(hc.rows,k=2)==2,], Colv=as.dendrogram(hc.cols), scale='none')

That works, but, I'd probably advise creating one heatmap and cutting it up in Illustrator, if need be. I have a nagging feeling that the color scale will end up being slightly different between the two clusters, since the range of values in each submatrix is different. Speaking of colors, if you don't like the default heat colors, try creating a new palette with color ramp.

palette <- colorRampPalette(c('#f0f3ff','#0033BB'))(256)
heatmap(mtscaled, Colv=F, scale='none', col=palette)

Confusing things

Another way to separate the clusters is to get the dendrograms out of heatmap and work with those. But Cutree applies to objects of class hclust, returned by hclust, and returns a map assigning each row in the original data to a cluster. Cutree takes either a height to cut at (h) or the desired number of clusters (k), which is nice.

Cut applies to dendrograms, which can be returned by heatmap if the keep.dendro option is set. Cut takes only h, not k, and returns a list with members upper and lower. Lower is a list of subtrees below the cut point.

Doing graphics with R starts easy, but gets arcane quickly. There's also a heatmap.2 function in the gplot package that adds color keys among other sparsely documented features.

This all needs some serious straightening out, but the basics are easy enough. Here are a couple more resources to make your heatmaps extra-hot:

...more on R.

Thursday, September 23, 2010

Geting started with CouchDB

I'm investigating using CouchDB for a data mining application. CouchDB is a schema-less document-oriented database that stores JSON documents and uses JavaScript as a query language. You write queries in the form of map-reduce. Applications connect to the database over a ReSTful HTTP API. So, Couch is a creature of the web in a lot of ways.

What I have in mind (eventually) is sharding a collection of documents between several instances of CouchDB each running on their own nodes. Then, I want to run distributed map-reduce queries over the whole collection of documents. But, I'm just a beginner, so we're going to start off with the basics. The CouchDB wiki has a ton of getting started material.

Couchdb's installation instructions cover several options for installing on Mac OS X, as well as other OS's. I used MacPorts.

sudo port selfupdate
sudo port install couchdb

Did I remember to update my port definitions the first time through? Of f-ing course not. Port tries to be helpful, but it's a little late sometimes with the warnings. Anyway, now that it's installed, let's start it up. I came across CouchDB on Mac OS 10.5 via MacPorts which tells you how to start CouchDB using Apple's launchctl.

sudo launchctl load /opt/local/Library/LaunchDaemons/org.apache.couchdb.plist
sudo launchctl start org.apache.couchdb

To verify that it's up and running, type:

curl http://localhost:5984/

...which should return something like:

{"couchdb":"Welcome","version":"1.0.1"}

Futon, the web based management tool for CouchDB can be browsed to at http://localhost:5984/_utils/.

Being a nerd, I tried to run Futon's test suite. After they failed, I found this: The tests run only(!) in a separate browser and that browser needs to be Firefox. Maybe that's been dealt with by now.

Let's create a test database and add some bogus records like these:

{
   "_id": "3f8e4c80b3e591f9f53243bfc8158abf",
   "_rev": "1-896ed7982ecffb9729a4c79eac9ef08a",
   "description": "This is a bogus description of a test document in a couchdb database.",
   "foo": true,
   "bogosity": 99.87526349
}

{
   "_id": "f02148a1a2655e0ed25e61e8cee71695",
   "_rev": "1-a34ffd2bf0ef6c5530f78ac5fbd586de",
   "foo": true,
   "bogosity": 94.162327,
   "flapdoodle": "Blither blather bonk. Blah blabber jabber jigaboo splat. Pickle plop dribble quibble."
}

{
   "_id": "9c24d1219b651bfeb044a0162857f8ab",
   "_rev": "1-5dd2f82c03f7af2ad24e726ea1c26ed4",
   "foo": false,
   "bogosity": 88.334,
   "description": "Another bogus document in CouchDB."
}

When I first looked at CouchDB, I thought Views were more or less equivalent to SQL queries. That's not really true in some ways, but I'll get to that later. For now, let's try a couple in Futon. First, we'll just use a map function, no reducer. Let's filter our docs by bogosity. We want really bogus documents.

Map Function

function(doc) {
  if (doc.bogosity > 95.0)
    emit(null, doc);
}

Now, let's throw in a reducer. This mapper emits the bogosity value for all docs. The reducer takes their sum.

Map Function

function(doc) {
  emit(null, doc.bogosity);
}

Reduce Function

function (key, values, rereduce) {
  return sum(values);
}

It's a fun little exercise to try and take the average. That's tricky because, for example, ave(ave(a,b), ave(c)) is not necessarily the same as ave(a,b,c). That's important because the reducer needs to be free to operate on subsets of the keys emitted from the mapper, then combine the values. The wiki doc Introduction to CouchDB views explains the requirements on the map and reduce functions. There's a great interactive emulator and tutorial on CouchDB and map-reduce that will get you a bit further writing views.

One fun fact about CouchDB's views is that they're stored in CouchDB as design documents, which are just regular JSON like everything else. This is in contrast to SQL where a query is a completely different thing from the data. (OK, yes, I've heard of stored procs.)

That's the basics. At this point, a couple questions arise:

  • How do you do parameterized queries? For example, what if I wanted to let a user specify a cut-off for bogosity at run time?
  • How do I more fully get my head around these map-reduce "queries"?
  • Can CouchDB do distributed map-reduce like Hadoop?

There's more to design documents than views. Both _show and _list functions let you transform documents. List functions use cursor-like iterator that enables on-the-fly filtering and aggregating as well. Apparently, there are plans for _update and _filter functions as well. I'll have to do some more reading and hacking and leave those for later.

Links

Saturday, August 21, 2010

Using R for Introductory Statistics, Chapter 3.4

...a continuing journey through Using R for Introductory Statistics, by John Verzani.

Simple linear regression

Linear regression is a kooky term for fitting a line to some data. This odd bit of terminology can be blamed on Sir Francis Galton, a prolific victorian scientist and traveler who saw it as related to his concept of regression toward the mean. Calling it a linear model is a little more straight-forward, and linear modeling through the lm function is bread-and-butter to R.

For example, let's look at the data set diamonds to see if there's a linear relationship between weight and cost of diamonds.

f = price ~ carat
plot(f, data=diamond, pch=5,
     main="Price of diamonds predicted by weight")
res = lm(f, data=diamond)
abline(res, col='blue')

We start by creating the formula f using the strange looking tilde operator. That tells the R interpreter that we're defining a symbolic formula, rather than an expression to be evaluated immediately. So, our definition of formula f says, "price is a function of carat". In the plot statement, the formula is evaluated in the context given by data=diamond, so that the variables in our formula have values. That gives us the scatter plot. Now let's fit a line using lm, context again given by data=diamond, and render the resulting object as a line using abline. Looks spiffy, but what just happened?

The equation of a line that we learned in high school is:

Minimizing squared error over our sample gives us estimates of the slope and intercept. The book presents this without derivation, which is a shame.


Maybe later, I'll get brave an try to insert a derivation here.

Examples

There's a popular linear model that applies to dating, which goes like this: It's OK for a man to date a younger woman if her age is at least half the man's age plus seven. In other words, this:

Apparently, I should be dating a 27 year old. Let me go ask my wife if that's OK. In the meantime, let's see how our rule compares to results of a survey asking the proper cutoff for dating for various ages.

plot(jitter(too.young$Male), jitter(too.young$Female),
     main="Appropriate ages for dating",
     xlab="Male age", ylab="Female age")
abline(7,1/2, col='red')
res <- lm(Female ~ Male, data=too.young)
abline(res, col='blue', lty=2)
legend(15,45, legend=c("half plus 7 rule",
       "Estimated from survey data"),
       col=c('red', 'blue'), lty=c(1,2))

That's a nice correspondence. On second thought, this is statistical proof that my daughter is not allowed to leave the house 'til she's 30.

Somehow related to that is the data set Animals, comparing weights of body and brain for several animals. The basic scatterplot not revealing much, we put the data on a log scale and find that it looks much better. As near as I can tell, the I or AsIs function does something like the opposite of the tilde operator. It tells the interpreter to go ahead and evaluate the enclosed expression. The general gist is to transform our data to log scale then apply linear modeling.

f = I(log(brain)) ~ I(log(body))
plot(f, data=Animals,
     main="Animals: brains vs. bodies",
     xlab="log body weight", ylab="log brain weight")
res = lm(f, data=Animals)
abline(res, col='brown')

Now the problem is, the line doesn't seem to fit very well. Those three outliers on the right edge have high body weights but less than expected going on upstairs. That seems to unduly influence the linear model away from the main trend. R contains some alternative algorithms for fitting a line to data. The function lqs is more resistant to outliers, like the large but pea-brained creatures in this example.

res.lqs = lqs(f, data=Animals)
abline(res.lqs, col='green', lty=2)

That's better. Finally, you might use identify to solve the mystery of the knuckleheaded beasts.

with(Animals, identify(log(body), log(brain), n=3, labels=rownames(Animals)))

Problem 3.31 is about replicate measurements, which might be a good idea where measurement error, noisy data, or other random variation is present. We follow the by now familiar procedure of defining our formula, doing a scatterplot, building our linear model, and finally plotting it over the scatterplot.

We are then asked to look at the variance of measurements at each particular voltage. To do that, we'll first split our data.frame up by voltage. The result is a list of vectors, one per voltage level.

breakdown.by.voltage = split(breakdown$time, breakdown$voltage)
str(breakdown.by.voltage)
List of 7
 $ 26: num [1:3] 5.8 1580 2323
 $ 28: num [1:5] 69 108 110 426 1067
 $ 30: num [1:11] 7.7 17 20 21 22 43 47 139 144 175 ...
 $ 32: num [1:15] 0.27 0.4 0.69 0.79 2.75 3.9 9.8 14 16 27 ...
 $ 34: num [1:19] 0.19 0.78 0.96 1.31 2.78 3.16 4.15 4.67 4.85 6.5 ...
 $ 36: num [1:15] 0.35 0.59 0.96 0.99 1.69 1.97 2.07 2.58 2.71 2.9 ...
 $ 38: num [1:7] 0.09 0.39 0.47 0.73 1.13 1.4 2.38

Next, let's compute the variance for each component of the above list and build a data.frame out of it.

var.by.voltage = data.frame(voltage=names(breakdown.by.voltage),
                            variance=sapply(breakdown.by.voltage,
                            FUN=var))

This split-apply-combine pattern looks familiar. It's basically a SQL group by in R. It's also the basis for Hadley Wickham's plyr library. Plyr's ddply function takes breakdown, a data.frame, and splits it on values of the voltage column. For each part, it computes the variance in the time column, then assembles the results back into a data.frame.

ddply(breakdown, .(voltage), .fun=function(df) {var(df$time)})

While that's not directly related to linear modeling, this kind of exploratory data manipulation is what R is made for.

More fun

Previous episode of Using R for Introductory Statistics

Sunday, February 21, 2010

The R type system

The R ProjectR is a weird beast. Through it's ancestor the S language, it claims a proud heritage reaching back to Bell Labs in the 1970's when S was created as an interactive wrapper around a set of statistical and numerical subroutines. As a programming language, R takes ideas from Unix shell scripting, functional languages (Lisp and ML), and also a little from C. Programmers will usually have at least some background in these languages, but one aspect of R that might remain puzzling is it's type system.

Because the purpose of R is programming with data, it has some fairly sophisticated tools to represent and manipulate data. First off, the basic unit of data in R is the vector. Even a single integer is represented as a vector of length 1. All elements in an atomic vector are of the same type. The sizes of integers and doubles are implementation dependent. Generic vectors, or lists, hold elements of varying types and can be nested to create compound data structures, as in Lisp-like languages.

Fundamental types

  • vectors
    • an ordered collection of elements all of one type
    • atomic types: logical, numeric (integer or double), complex, character or raw
    • special values:
      • NA (not available, missing data)
      • NaN (not a number)
      • +/-Inf (infinity)
  • lists
    • generic vectors, elements can be of any type, including list
    • because they can be nested, lists are sometimes called recursive
  • functions
    • functions are "first class" data types
    • can be assigned, passed as arguments and returned from functions
# a is a vector of length 1
> a <- 101
> length(a)
[1] 1

# the function c() combines is arguments
# construct a vector of numeric data and access its members
> ages <- c(40, 36, 2, 38, 27, 1)
> ages[2]
[1] 36
> ages[4:6]
[1] 38 27  1

> movie <- list(title='Monty Python\'s The Meaning of Life', year=1983, cast=c('Graham Chapman','John Cleese','Terry Gilliam','Eric Idle','Terry Jones','Michael Palin'))
> movie
$title
[1] "Monty Python's The Meaning of Life"
$year
[1] 1983
$cast
[1] "Graham Chapman" "John Cleese"    "Terry Gilliam"  "Eric Idle"      "Terry Jones"    "Michael Palin"

Attributes

R objects can have attributes - arbitrary key/value pairs - attached to them. One use for this is that elements in vectors or lists can be named. R's object system is based on the class attribute. (OK, I really mean the simpler of R's two object systems, but let's avoid that topic.) Attributes are also used to turn one-dimensional vectors into multi-dimensional structures by specifying their dimensions, as we'll see next.

Matrices and arrays

Matrices and arrays are special types of vectors, distinguished by having a dim (dimensions) attribute. A matrix has two dimensions, so the value of its dim attribute is a vector of length 2 specifying numbers of rows and columns in the matrix. Arrays are n dimensional vectors, sometimes used like an OLAP data cube, with dimension vectors of length n.

# create some data series
> bac = c(14.08, 7.05, 13.05, 16.21)
> hbc = c(48.67, 29.51, 41.93, 55.82)
> jpm = c(31.53, 28.14, 33.77, 41.37)

# create a matrix whose rows are companies and columns are quarters
# values in the matrix is closing stock price on the first day of the quarter
> m <- matrix(c(bac,hbc,jpm), nrow=3, byrow=T)
> rownames(m) <- c('bac','hbc','jpm')
> colnames(m) <- c('q1', 'q2', 'q3', 'q4')

> m
       q1    q2    q3    q4
bac 14.08  7.05 13.05 16.21
hbc 48.67 29.51 41.93 55.82
jpm 31.53 28.14 33.77 41.37

# check out the attributes
> attributes(m)
$dim
[1] 3 4
$dimnames
$dimnames[[1]]
[1] "bac" "hbc" "jpm"
$dimnames[[2]]
[1] "q1" "q2" "q3" "q4"

Factors

Statisticians divide data into four types: nominal, ordinal, interval and ratio. Factors are for the first two, depending on whether they are ordered or not. This makes a difference for some of the stats algorithms in R, but from a programmers point of view, a factor is just an enum. R turns character vectors into factors at the slightest provocation. It's sometimes necessary to coerce factors back to character strings, using as.character().

  • represent categorical or rank data compactly
  • examples: countries, male/female, small/medium/large, etc.

Data frames

A data frame is a special list in which all elements are vectors of equal length. It is analagous to a table in a database, except that it's column-oriented rather than row-oriented. Because the vectors are constrained to be of the same length, you can index any cell in a data frame by its row and column.

  • a list of vectors of the same length (columns)
  • like a table in a database
# make a simple data frame
> df <- data.frame(ticker=c('bac', 'hbc', 'jpm'), market.cap=c(137.37, 185.65, 157.80), yield=c(0.25,3.00,0.50))
> df
  ticker market.cap yield
1    bac     137.37  0.25
2    hbc     185.65  3.00
3    jpm     157.80  0.50

There's more, of course, but this gives you enough to be dangerous. Note that, because R natively works with vectors, many operations in R are vectorized, meaning they operate on whole vectors at once, rather than on a single scalar value. The key to performance in R is making good use of vectorized operations. Also, being functional, R inherits a full compliment of higher-order functions - Map, Reduce, Filter and many forms of apply (lapply, sapply, and tapply). Mixing higher-order functions and vectorized operations can get confusing (and is the source of the proliferation of apply functions). Both these techniques, as well as the organization of the type system, encourage you to work with blocks of data as a unit. This is what John Chambers called high-level prototyping for computations with data.

More information

Saturday, January 09, 2010

Pivot tables in R

The R ProjectA common data-munging operation is to compute cross tabulations of measurements by categories. SQL Server and Excel have a nice feature called pivot tables for this purpose. Here we'll figure out how to do pivot operations in R.

Let's imagine an experiment where we're measuring the gene activity of an organism under different conditions -- exposure to different nutrients and toxins. Our conditions are silly: copper, beer, pizza, and cheetos. First we make a list of genes. Then expand.grid generates all combinations of genes and conditions. Finally, we tack on a column of randomly generated measurements.

> genes = paste('MMP', sprintf("%04d",1:10), sep="")
> data = expand.grid(gene=genes, condition=c('copper', 'cheetos', 'beer', 'pizza'))
> data$value = rnorm(40)
> data
      gene condition       value
1  MMP0001    copper  0.90412805
2  MMP0002    copper  0.92664376
3  MMP0003    copper  0.27772147
4  MMP0004    copper  0.08958930
5  MMP0005    copper -0.20132304
6  MMP0006    copper  0.34524729
7  MMP0007    copper -0.33910206
8  MMP0008    copper  1.21006486
9  MMP0009    copper  0.78008022
10 MMP0010    copper  1.05364315
11 MMP0001   cheetos -2.31796229
12 MMP0002   cheetos  0.76706591
13 MMP0003   cheetos -2.93692935
14 MMP0004   cheetos  0.25452306
15 MMP0005   cheetos  0.24168329
16 MMP0006   cheetos  0.28739734
17 MMP0007   cheetos  0.69233543
18 MMP0008   cheetos  0.48865250
19 MMP0009   cheetos -0.11129319
20 MMP0010   cheetos  0.53322842
21 MMP0001      beer -0.74965948
22 MMP0002      beer  0.27105205
23 MMP0003      beer -0.99261363
24 MMP0004      beer  0.65143639
25 MMP0005      beer -0.35589696
26 MMP0006      beer  1.40147484
27 MMP0007      beer  0.37492710
28 MMP0008      beer  0.64453865
29 MMP0009      beer  0.35925345
30 MMP0010      beer  0.96394785
31 MMP0001     pizza -1.91818504
32 MMP0002     pizza  0.31690523
33 MMP0003     pizza -1.20566043
34 MMP0004     pizza -1.91750166
35 MMP0005     pizza  1.98010023
36 MMP0006     pizza  0.90468249
37 MMP0007     pizza  0.04284970
38 MMP0008     pizza -0.08141461
39 MMP0009     pizza -0.72471771
40 MMP0010     pizza -0.01085060

We want to pivot the conditions into columns so that we end up with one column for each condition and one row for each gene. The easy way is to use the reshape package by Hadley Wickham, which is made for restructuring data and does this job nicely. If you don't already have it, you'll have to run install.packages, then load the library.

> install.packages('reshape')
> library(reshape)

Using cast to move conditions into columns is a snap.

> cast(data, gene ~ condition)
      gene     copper    cheetos       beer       pizza
1  MMP0001  0.9041281 -2.3179623 -0.7496595 -1.91818504
2  MMP0002  0.9266438  0.7670659  0.2710521  0.31690523
3  MMP0003  0.2777215 -2.9369294 -0.9926136 -1.20566043
4  MMP0004  0.0895893  0.2545231  0.6514364 -1.91750166
5  MMP0005 -0.2013230  0.2416833 -0.3558970  1.98010023
6  MMP0006  0.3452473  0.2873973  1.4014748  0.90468249
7  MMP0007 -0.3391021  0.6923354  0.3749271  0.04284970
8  MMP0008  1.2100649  0.4886525  0.6445386 -0.08141461
9  MMP0009  0.7800802 -0.1112932  0.3592535 -0.72471771
10 MMP0010  1.0536432  0.5332284  0.9639479 -0.01085060

Done!

That was too easy

Just as an exercise, what would we have to do without reshape? And, just to keep ourselves honest, let's make sure we can deal with missing data (as reshape can). Make some data go missing:

> data.incomplete <- data[data$value > -1.0,]
> dim(data.incomplete)
[1] 35  3

Now, split the data frame up by condition. This produces a list where each element is a data frame containing a subset of the data for each condition. Notice that the cheetos data frame has values for 8 of the 10 genes.

> data.by.condition <- split(data.incomplete, data.incomplete$condition)
> typeof(data.by.condition)
[1] "list"
> names(data.by.condition)
[1] "copper"  "cheetos" "beer"    "pizza"  
> data.by.condition$cheetos
      gene condition      value
12 MMP0002   cheetos  0.7670659
14 MMP0004   cheetos  0.2545231
15 MMP0005   cheetos  0.2416833
16 MMP0006   cheetos  0.2873973
17 MMP0007   cheetos  0.6923354
18 MMP0008   cheetos  0.4886525
19 MMP0009   cheetos -0.1112932
20 MMP0010   cheetos  0.5332284

We're going to recombine the data into a data frame with one row for each gene, so let's get that started:

> result = data.frame(gene=genes)

Now comes some executable line noise. We're going to loop through the list and add a column to the result data frame during each iteration of the loop. We pull the column out of the data frame in the list, but we have to make sure the column has an element for each gene. Merging with the all parameter set is like an outer join. We get a row for each gene, inserting NA's where there data is missing.

> for (i in seq(along=data.by.condition)) { result[[names(data.by.condition)[i]]] <- merge(data.by.condition[[i]], genes, by.x='gene', by.y=1, all=T)$value }

> result
      gene     copper    cheetos       beer       pizza
1  MMP0001  0.9041281         NA -0.7496595          NA
2  MMP0002  0.9266438  0.7670659  0.2710521  0.31690523
3  MMP0003  0.2777215         NA -0.9926136          NA
4  MMP0004  0.0895893  0.2545231  0.6514364          NA
5  MMP0005 -0.2013230  0.2416833 -0.3558970  1.98010023
6  MMP0006  0.3452473  0.2873973  1.4014748  0.90468249
7  MMP0007 -0.3391021  0.6923354  0.3749271  0.04284970
8  MMP0008  1.2100649  0.4886525  0.6445386 -0.08141461
9  MMP0009  0.7800802 -0.1112932  0.3592535 -0.72471771
10 MMP0010  1.0536432  0.5332284  0.9639479 -0.01085060

Extra finesse points if you can figure out how to do that last step with Reduce instead of a loop.

Sunday, December 27, 2009

SQL group by in R

The R ProjectThe R statistical computing environment is awesome, but weird. How to do database operations in R is a common source of questions. The other day I was looking for an equivalent to SQL group by for R data frames. You need this to compute summary statistics on subsets of a data set divided up by some categorical variable. It turns out there are several ways to get the same effect, some more limited than others.

The best answer seems to be plyr. It automates the The split-apply-combine strategy for data analysis you'd use otherwise. The ddply splits a data frame into subset data frames, performs some function on the subsets, and returns the results as a recombined data frame.

Here's a few links: A Fast Intro to Plyr for R, Block-processing a data frame with plyr and Split, apply, and combine in R using PLYR.

This paper is worth reading. It introduces the library and also gives you a nice framework (split-apply-combine) for thinking about a whole class of data-munging problems. A coworker (thanks, Gustavo) pointed out that this is a lot like Google's MapReduce.

Some commands that get you part of the way there are: split, by, tapply (nicely explained here), aggregate. The R wiki has an entry on Performing calculations within sub-sets of a data-frame that uses the reshape library. You could always use sqldf or RSQLite. Several options are discussed here. You can cobble up a fully general process using split, some form of sapply, and unsplit. But, that's what plyr does automatically.

Side notes: While fooling around with this, I noticed that, for some crazy reason, split.data.frame splits matrices into nice subunits, but split has the ugly side-effect of reducing matrices to vectors. Also, Google has a style guide for R.

More R mini-tutorials:

Links

Thursday, December 17, 2009

Joining data frames in R

The R ProjectWant to join two R data frames on a common key? Here's one way do a SQL database style join operation in R.

We start with a data frame describing probes on a microarray. The key is the probe_id and the rest of the information describes the location on the genome targeted by that probe.

> head(probes)
          probe_id sequence strand   start     end
1 mm_ex_fwd_000541      Chr      + 1192448 1192507
2 mm_ex_fwd_000542      Chr      + 1192453 1192512
3 mm_ex_fwd_000543      Chr      + 1192458 1192517
4 mm_ex_fwd_000544      Chr      + 1192463 1192522
5 mm_ex_fwd_000545      Chr      + 1192468 1192527
6 mm_ex_fwd_000546      Chr      + 1192473 1192532

> dim(probes)
[1] 241019      5

We also have a bunch of measurements in a numeric vector. For each probe (well, a few probes missing due to bad data) we have a value.

> head(value)
mm_fwd_000002 mm_fwd_000003 mm_fwd_000004 mm_fwd_000005 mm_fwd_000006 mm_fwd_000007 
   0.05294899    0.11979251    0.28160017    0.57284569    0.74402510    0.78644199 

> length(value)
[1] 241007

Let's join up these tables, er data frame and vector. We'll use the match function. Match returns a vector of positions of the (first) matches of its first argument in its second (or NA if there is no match). So, we're matching our values into our probes.

> joined = cbind(probes[match(names(value), probes$probe_id),], value)

> dim(joined)
[1] 241007      6

> head(joined)
          probe_id sequence strand start end         value
3695 mm_fwd_000002      Chr      +    15  74 0.05294899
3696 mm_fwd_000003      Chr      +    29  88 0.11979251
3697 mm_fwd_000004      Chr      +    43 102 0.28160017
3698 mm_fwd_000005      Chr      +    57 116 0.57284569
3699 mm_fwd_000006      Chr      +    71 130 0.74402510
3700 mm_fwd_000007      Chr      +    85 144 0.78644199

Merge is probably more similar to a database join.

Inner joinmerge(df1, df2, by="common_key_column")
Outer joinmerge(df1, df2, by="common_key_column", all=TRUE)
Left outermerge(df1, df2, by="common_key_column", all.x=TRUE)
Right outermerge(df1, df2, by="common_key_column", all.y=TRUE)

If we have two data frames, we can use merge. Let's convert our vector tp to a data frame and merge, getting the same result (in a different sort order).

> tp.df = data.frame(probe_id=names(tp), value=tp)

> head(tp.df)
                   probe_id      value
mm_fwd_000002 mm_fwd_000002 0.05294899
mm_fwd_000003 mm_fwd_000003 0.11979251
mm_fwd_000004 mm_fwd_000004 0.28160017
mm_fwd_000005 mm_fwd_000005 0.57284569
mm_fwd_000006 mm_fwd_000006 0.74402510
mm_fwd_000007 mm_fwd_000007 0.78644199

> m = merge(probes, tp.df, by="probe_id")

> dim(m)
[1] 241007      6

> head(mmm)
          probe_id sequence strand   start     end     value
1 mm_ex_fwd_000541      Chr      + 1192448 1192507 0.1354668
2 mm_ex_fwd_000542      Chr      + 1192453 1192512 0.1942794
3 mm_ex_fwd_000543      Chr      + 1192458 1192517 0.1924457
4 mm_ex_fwd_000544      Chr      + 1192463 1192522 0.2526351
5 mm_ex_fwd_000545      Chr      + 1192468 1192527 0.1922655
6 mm_ex_fwd_000546      Chr      + 1192473 1192532 0.2610747

There's a good discussion of merge on Stack Overflow, which includes right, left, inner and outer joins. Also the R wiki covers both match and merge. See also, the prior entry on select operations on R data frames.

Wednesday, August 26, 2009

Using R and Bioconductor for sequence analysis

Here's another quick R vignette, in case I pick this up later and need to remind myself where I got stuck. I was trying to use R for a bit of basic sequence analysis, with mixed results.

First, install the BSgenome package, which is part of Bioconductor. Get GeneR while you're at it.

> source("http://bioconductor.org/biocLite.R")
> biocLite("BSgenome")
> biocLite("GeneR")

Follow the instructions in the document How to forge a BSgenome data package. You'll need to get fasta files from somewhere such as NCBI's Entrez Genome. Another nice data source is Regulatory Sequence Analysis Tools.

I created a BSgenome package for our favorite model organism Halobacterium salinarum NRC-1, which I named halo for short. Now, I can ask what sequences make up the halo genome and find out how long they are.

> library(BSgenome.halo.NCBI.1)
> seqnames(halo)
[1] "chr"     "pNRC200" "pNRC100"
> seqlengths(halo)
    chr pNRC200 pNRC100 
2014239  365425  191346
> length(halo$chr)
[1] 2014239

There are a few things I wanted to do next. First, I wanted to load a list of genes with their coordinates. That should allow me to quickly get the sequence for each gene, or get sequence of upstream regions for regulatory motif finding. Second, if I'm going to find any new protein coding regions, I'd like to have a function that could take a stretch of DNA and find ORFs (open reading frames). As far as I can tell, all there is to ORF finding is searching each reading frame for long stretches that start with a methionine (AUG) and end with a stop codon (UAG, UGA, and UAA ). Maybe there's more to it than that.

This is where I left off. GeneR seems to use an entirely different way of encoding sequence based on buffers. I have to admit to being a little disappointed. I hope it's just my cluelessness and there's really a reasonable way to do this kind of thing in R and Bioconductor.

Related stuff from Blue Collar Bioinformatics

Monday, July 27, 2009

Getting sequence data out of NCBI Entrez

Thanks to a coworker, I finally found out how to get sequence data out of NCBI programmatically. The catch was that I wanted to get a chunk of sequence at a time, without needing to download the whole genome. Now, I can do that through NCBI's eutils. Yay! Here's a link to the key efetch help page.

First we can use the elink call to get a list of sequences (seems to return GI accession numbers) related to a genome project:

http://www.ncbi.nlm.nih.gov/entrez/eutils/elink.fcgi?dbfrom=genomeprj&id=217&db=nucleotide

I suppose you'll have to make a few more calls to figure out which sequence is which, but I happen to know the one I want is 15789340. So, getting a chunk of sequence is as simple as this:

efetch.fcgi?db=nucleotide&id=15789340&seq_start=528770&seq_stop=531343&rettype=fasta

You can also use refseq accession numbers instead of GIs:

efetch.fcgi?db=nucleotide&id=NC_002607&seq_start=528770&seq_stop=531343&rettype=fasta

You can even do tricky stuff like get a gene (in this case VNG1179C) in the reverse strand along with 70 nucleotides on either side.

efetch.fcgi?db=nucleotide&id=NC_002607&seq_start=888547&seq_stop=889397&strand=2&rettype=fasta

For more laughs, see my previous inept fumbling related to NCBI.

Friday, July 17, 2009

Parsing GEO SOFT files with Python and Sqlite

NCBI's GEO database of gene expression data is a great resource, but its records are very open ended. This lack of rigidity was perhaps necessary to accommodate the variety of measurement technologies, but makes getting data out a little tricky. But, all that flexibility is a curse from the point of view of extracting data. The scripts I end up with are not general parsers for GEO data, but will need to be adapted to the specifics of other datasets.

Note: It could be that I'm doing things the hard way. Maybe there's an easier way.

A GEO record consists of a platform, which describes (for example) a microarray and its probes, and series of samples. In this example, we need to do a join between the platform and the sample records to end up with a matrix of the form (seq, strand, start, end, value1, value2, ..., valueN) where the value1 column holds measurements from the first sample and so on. If we do that, we'll have coordinates on the genome and values for each measurement. My goal is to feed data into a genome browser known as HeebieGB with a stop-over in R along the way.

Merging on a common key is only slightly complicated, but tiling arrays are big (~244,000 probes in this case). I hesitate to try merging several 244K row tables in memory. Database engines are made for this sort of thing, so I'll use SQLite to get this done and Python to script the whole process.

I like to start python scripts with a template similar to Guido's main function, except that I prefer optparse to getopt. An --overwrite option will force the user to be conscious of overwriting files.

import sys
from optparse import OptionParser

def main():
 usage = "%prog [options] input_file sqlite_db_file"
 parser = OptionParser(usage=usage)
 parser.add_option("-o", "--overwrite", dest="overwrite", default=False, action="store_true", 
  help="if output db file exists, overwrite it")
 (options, args) = parser.parse_args()

 if len(args) < 2:
  parser.error("missing required arguments.")
  exit(2)

 input_filename = args[0]
 db_filename = args[1]

if __name__ == "__main__":
 sys.exit(main())

GEO records a bunch of descriptive data about each sample, some of which we want. I've read that storing arbitrary key-value pairs in a relational DB is considered bad by some. But, I'm going to do it anyway. The entity attributes will go in a table called attributes whose schema is (entity_id, key, value).

The function parse_platform_table pulls the platform data from a tab-separated section in the SOFT file into a table with a schema something like this: (id, sequence, strand, start, end). There's also a tab-separated section for each of the samples that refers back to its platform, so I extract that in a similar manner in parse_sample_table. It's easiest to start out with each sample in its own table, even though that's not really what we want.

The complete script -also available from SVN here- ends up like this:

import sys
from optparse import OptionParser
import re
import os
import os.path
import sqlite3

# GEO SOFT format is documented here:
# http://www.ncbi.nlm.nih.gov/projects/geo/info/soft2.html#SOFTformat

# ID field in platform joins with ID_REF field in samples

entity       = re.compile(r'\^(\S+) = (.+)')
kvp          = re.compile(r'!(\S+) = (.+)')

STATE_START = 0
STATE_IN_SERIES = 1001
STATE_IN_PLATFORM = 1002
STATE_IN_SAMPLE = 1003


def overwrite(name):
 if os.path.exists(name):
  os.remove(name)
  return True
 return False

def parse_series_file(file, conn):
 entity_id = None
 state = STATE_START

 # create an attributes table
 try:
  cursor = conn.cursor()
  cursor.execute('create table attributes (entity_id, key, value);')
  conn.commit()
  cursor.close()
 finally:
  cursor.close()

 for line in file:
  line = line.strip()

  # read entity tags
  if line.startswith('^'):
   m = entity.match(line)
   if m:
    entity_type = m.group(1)
    entity_id = m.group(2)
    print(entity_id)
    if entity_type == 'SERIES':
     state = STATE_IN_SERIES
    elif entity_type == 'PLATFORM':
     state = STATE_IN_PLATFORM
    elif entity_type == 'SAMPLE':
     state = STATE_IN_SAMPLE

  # read attribute key-value pairs and tab-separated tables
  elif line.startswith('!'):
   m = kvp.match(line)
   if m:
    key = m.group(1)
    value = m.group(2)
    handle_attribute(conn, entity_id, key, value)
   elif state==STATE_IN_PLATFORM and line=='!platform_table_begin':
    parse_platform_table(file, conn, entity_id)
   elif state==STATE_IN_SAMPLE and line=='!sample_table_begin':
    parse_sample_table(file, conn, entity_id)

def parse_platform_table(file, conn, platform_id):
 """
 Read the tab-separated platform section of a SOFT file and store the ID,
 sequence, strand, start, and end columns in a SQLite database.

 file: a file object open for reading
 conn: a SQLite database connection
 platform_id: a string identifying a GEO platform
 """
 cursor = conn.cursor()
 try:
  # throw away line containing column headers
  file.next()
  # create platform table
  cursor.execute('create table %s (id integer primary key not null, sequence text not null, strand not null, start integer not null, end integer not null, control_type integer);' % (platform_id))
  conn.commit()
  sql = 'insert into %s values(?,?,?,?,?,?)' % (platform_id)
  for line in file:
   line = line.strip('\n')
   if (line.strip() == '!platform_table_end'):
    break
   fields = line.split("\t")
   cursor.execute(sql, (int(fields[0]), fields[6], fields[10], fields[7], fields[8], fields[4]))
  conn.commit()
 finally:
  cursor.close()

def parse_sample_table(file, conn, sample_id):
 """
 Read a tab separated sample section from a SOFT file and store ID_REF and
 value in a SQLite DB.

 file: a file object open for reading
 conn: a SQLite database connection
 sample_id: a string identifying a GEO sample
 """
 cursor = conn.cursor()
 try:
  # throw away line containing column headers
  file.next()
  # create sample table
  cursor.execute('create table %s (id_ref integer not null, value numeric not null);' % (sample_id))
  conn.commit()
  sql = 'insert into %s values(?,?)' % (sample_id)
  for line in file:
   line = line.strip('\n')
   if (line.strip() == '!sample_table_end'):
    break
   fields = line.split("\t")
   cursor.execute(sql, (int(fields[0]), float(fields[1])))
  conn.commit()
 finally:
  cursor.close()

def handle_attribute(conn, entity_id, key, value):
 """
 Store an entity attribute in the attributes table
 """
 cursor = None
 try:
  cursor = conn.cursor()
  cursor.execute("insert into attributes values(?,?,?);", (entity_id, key, value))
  conn.commit()
 finally:
  if cursor:
   cursor.close()


def main():
 usage = "%prog [options] input_file"
 parser = OptionParser(usage=usage)
 parser.add_option("-o", "--overwrite", dest="overwrite", default=False, action="store_true", 
  help="if output db file exists, overwrite it")
 (options, args) = parser.parse_args()

 if len(args) < 2:
  parser.error("missing required arguments.")
  exit(2)

 input_filename = args[0]
 db_filename = args[1]

 if options.overwrite:
  overwrite(db_filename)

 input_file = None
 conn = None
 try:
  conn = sqlite3.connect(db_filename)
  input_file = open(input_filename, 'r')
  parse_series_file(input_file, conn)
 finally:
  if input_file:
   input_file.close()
  if conn:
   conn.close()


if __name__ == "__main__":
 sys.exit(main())

The specific series I'm interested in (GSE12923) has 53 samples. The platform (GPL7255) is a custom array on Agilent's 244k feature microarrays or just short of 13 million individual features. The SOFT file is 708 MB and the script takes a good 5 or 6 minutes to ingest all that data. The next step is merging all the data into a single matrix.

This turned out to be harder than I thought. At first, I naively tried to do a big 54 way join between the platform table and all the sample tables, with an order-by to sort by chromosomal location. I let this run for a couple hours, then gave up. Sure, a big join on unindexed tables was bound to be ugly, but it only had to run once. I'm still surprised that this choked, after all, it's not that much data.

There are two ways around it. One is to index the sample tables by ID_REF and the platform table by (sequence, strand, start, end). The other is to do the big join then sort into a second table. Either takes several minutes, but it's just a one-off, so that's OK.

insert into matrix
select GPL7255.sequence, GPL7255.strand, GPL7255.start, GPL7255.end,
GSM320660.VALUE as GSM320660,
GSM320661.VALUE as GSM320661,
...GSM320712.VALUE as GSM320712
from GPL7255
join GSM320660 on GPL7255.ID = GSM320660.ID_REF
join GSM320661 on GPL7255.ID = GSM320661.ID_REF
...join GSM320712 on GPL7255.ID = GSM320712.ID_REF
where GPL7255.control_type==0 and sequence!='NA';
order by sequence, strand, start, end;

Now that we've done that, do you ever find data that doesn't need to be cleaned up a little bit?

-- swap mislabeled + and - strands (how embarrassing!)
update matrix set strand='Z' where strand='-';
update matrix set strand='-' where strand='+';
update matrix set strand='+' where strand='Z';

-- fix up sequence names
update matrix set sequence='chromosome' where sequence='chr1';
update matrix set sequence='pNRC200' where sequence='chr2';
update matrix set sequence='pNRC100' where sequence='chr3';

-- fix probes crossing the "zero" point
update matrix set start=end, end=start where end-start > 60;

That's about all the data munging I can stand for now. The rest, I'll leave for Part 2.

Thursday, July 02, 2009

R String processing

Note: Nowadays, stringr's str_match solves this problem, nicely. Another option is gsubfn's very R-ish strapply.

Here's a little vignette of data munging using the regular expression facilities of R (aka the R-project for statistical computing). Let's say I have a vector of strings that looks like this:

> coords
[1] "chromosome+:157470-158370" "chromosome+:158370-158450" "chromosome+:158450-158510"
[4] "chromosome+:158510-159330" "chromosome-:157460-158560" "chromosome-:158560-158920"

What I'd like to do is parse these out into a data.frame with a column for each of sequence, strand, start, end. A regex that would do that kind of thing looks like this: (.*)([+-]):(\d+)-(\d+). R does regular expressions, but it's missing a few pieces. For example, in python you might say:

import re

coords = """
chromosome+:157470-158370
chromosome+:158370-158450
chromosome+:158450-158510
chromosome+:158510-159330
chromosome-:157460-158560
chromosome-:158560-158920
"""

regex = re.compile("(.*)([+-]):(\\d+)-(\\d+)")

for line in coords.split("\n"):
 line = line.strip()
 if (len(line)==0): continue
 m = regex.match(line)
 if (m):
  seq = m.group(1)
  strand = m.group(2)
  start = int(m.group(3))
  end = int(m.group(4))
  print "%s\t%s\t%d\t%d" % (seq, strand, start, end)

As far as I've found, there doesn't seem to be an equivalent in R to regex.match, which is a shame. The gsub function supports capturing groups in regular expressions, but isn't very flexible about what you do with them. One way to solve this problem is to use gsub to pull out each individual column. Not efficient, but it works:

> coords.df = data.frame(
 seq=gsub("(.*)([+-]):(\\d+)-(\\d+)", "\\1", row.names(m), perl=T),
 strand=gsub("(.*)([+-]):(\\d+)-(\\d+)", "\\2", row.names(m), perl=T),
 start=as.integer(gsub("(.*)([+-]):(\\d+)-(\\d+)", "\\3", row.names(m), perl=T)),
 end=as.integer(gsub("(.*)([+-]):(\\d+)-(\\d+)", "\\4", row.names(m), perl=T)))
> coords.df
         seq strand  start    end
1 chromosome      + 157470 158370
2 chromosome      + 158370 158450
3 chromosome      + 158450 158510
4 chromosome      + 158510 159330
5 chromosome      - 157460 158560
6 chromosome      - 158560 158920

It seems strange that R doesn't have a more direct way of accomplishing this. I'm not an R expert, so maybe it's there and I'm missing it. I guess it's not called the R project for string processing, but still... By the way, if you're ever tempted to name a project with a single letter, consider the poor schmucks trying to google for help.

Tuesday, June 02, 2009

How to plot a graph in R

Here's a quick tutorial on how to get a nice looking graph out of R (aka the R Project for Statistical Computing). Don't forget that help for any R command can be displayed by typing the question mark followed by the command. For example, to see help on plot, type ?plot.

Let's start with some data from your friends, the Federal Reserve. The fed keeps lots of interesting economic data and they make it pretty easy to get at. What if we're curious about the value of the US Dollar? How's it doing against other major currencies? Let's have a look. I'll use the Nominal Major Currencies Dollar Index. The fed gives us the data here:

http://www.federalreserve.gov/releases/h10/Summary/

First, download the file and load it into your favorite text editor. Replace \s\s+ with \t to create two tab delimited columns. I think this is probably easier than trying to get R to read data separated by at least 2 spaces, as the source file seems to be. Now, load your data into R.

d = read.table('dollar_vs_major_currencies_index.txt', header=F, sep="\t", col.names=c("month", "index"))
dim(d)
[1] 437   2
head(d)
     month    index
1 JAN 1973 108.1883
2 FEB 1973 103.7461
3 MAR 1973 100.0000
4 APRimg 1973 100.8251
5 MAY 1973 100.0602
6 JUN 1973  98.2137

R will show you the structure of an object using the str() command:

str(d)
'data.frame': 437 obs. of  2 variables:
 $ month: Factor w/ 437 levels "APR 1973","APR 1974",..: 147 110 256 1 293 220 184 38 402 366 ...
 $ index: num  108 104 100 101 100 ...

So far so good. R is all about stats, so why not do this?

summary(d$index)
   Min. 1st Qu.  Median    Mean 3rd Qu.    Max. 
  70.32   87.93   95.89   97.48  105.40  143.90

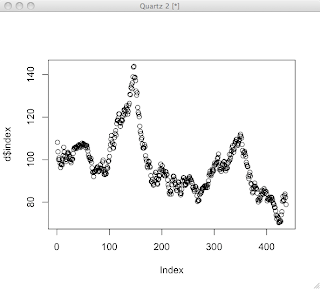
OK, let's get to some plotting. First off, let's try a simple case.

plot(d$index)

That's OK for quickly looking at some data, but doesn't look that great. R can make reasonable guesses, but creating a nice looking plot usually involves a series of commands to draw each feature of the plot and control how it's drawn. I've found that it's usually best to start with a stripped down plot, then gradually add stuff.

Start out bare-bones. All this does is draw the plot line itself.

plot(d$index, axes=F, ylim=c(0,150), typ='l', ann=F)
axes=Fdon't draw axes
ann=Fdon't draw annotations, by which they mean the titles for the plot and the axes
typ='l'draw a line plot
ylimset limits on y axis

Next, let's add the x-axis nicely formatted. We'll use par(tcl=-0.2) to create minor tick marks. The first axis command draws those, but doesn't draw labels. The second axis command draws the major tick marks and labels the years on even decades.

par(tcl= -0.2)
axis(1, at=seq(1, 445, by=12), labels=F, lwd=1, lwd.ticks=1)
par(tcl= -0.5)
axis(1, at=seq(1 + 12*2, 450, by=60), labels=seq(1975,2010,5), lwd=0, lwd.ticks=2)

Note that there's an R package called Hmisc, which might have made these tick marks easier if I had figured it out. Next, we'll be lazy and let R decide how to draw the y-axis.

axis(2)

I like a grid that helps line your eye up with the axes. There's a grid command, which seemed to draw grid lines wherever it felt like. So, I gave up on that and just drew my own lines that matched my major tick marks. The trick here is to pass a sequence in as the argument for v or h (for vertical and horizontal lines). That way, you can draw all the lines with one command. Well, OK, two commands.

abline(v=(12*(seq(2,32,by=5)))+1, col="lightgray", lty="dotted")
abline(h=(seq(0,150,25)), col="lightgray", lty="dotted")

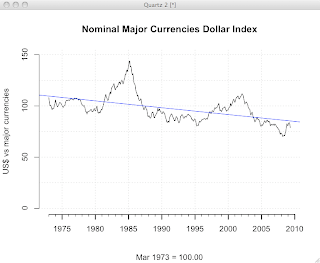
Let's throw some labels on with the title command.

title(main="Nominal Major Currencies Dollar Index", sub="Mar 1973 = 100.00", ylab="US$ vs major currencies")

Finally, let's bust out a linear regression. The lm() function, which fits a linear model to the data, has some truly bizarre syntax using a ~ character. The docs say, "The tilde operator is used to separate the left- and right-hand sides in model formula. Usage: y ~ model." I don't get at all how this is an operator. It seems to mean y is a function of model? ...maybe? In any case, this works. I'm taking it as voodoo.

linear.model = lm(d$index ~ row(d)[,1])
abline(linear.model)

Now, we have a pretty nice looking plot.

The full set of commands is here, for your cutting-and-pasting pleasure.

plot(d$index, axes=F, ylim=c(0,150), typ='l', ann=F)
par(tcl= -0.2)
axis(1, at=seq(1, 445, by=12), labels=F, lwd=1, lwd.ticks=1)
par(tcl= -0.5)
axis(1, at=seq(1 + 12*2, 450, by=60), labels=seq(1975,2010,5), lwd=0, lwd.ticks=2)
par(tcl= -0.5)
axis(2)
abline(v=(12*(seq(2,32,by=5)))+1, col="lightgray", lty="dotted")
abline(h=(seq(0,150,25)), col="lightgray", lty="dotted")
title(main="Nominal Major Currencies Dollar Index", sub="Mar 1973 = 100.00", ylab="US$ vs major currencies")
linear.model = lm(d$index ~ row(d)[,1])
abline(linear.model, col="blue")

...more on R.