 Information graphics is becoming such a hot area. Edward Tufte was just in business week (slides). I want to be a data scientist when I grow up. One potential role mode is Hans Rosling, the swedish professor behind Gapminder. He has talks on economic development and poverty which use their trendalyzer software. That makes me want to acquire the three skills of data geeks, stats, data munging, and visualization.
Sunday, June 28, 2009
Information Visualization
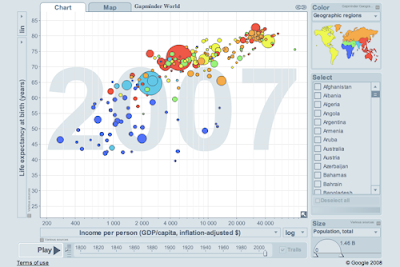
Information graphics is becoming such a hot area. Edward Tufte was just in business week (slides). I want to be a data scientist when I grow up. One potential role mode is Hans Rosling, the swedish professor behind Gapminder. He has talks on economic development and poverty which use their trendalyzer software. That makes me want to acquire the three skills of data geeks, stats, data munging, and visualization.
Subscribe to:
Post Comments (Atom)


 R Bloggers
Visual Complexity's Information Visualization Manifesto.
ReplyDeletehttp://www.visualcomplexity.com/vc/blog/?p=644