Monday, December 27, 2010

Cloud bioinformatics

Personally, the thing I love about cloud computing is never having to ask permission. There's no ops guy or pointy-haired boss between me and the launch-instance button. As lovely as that is, the cloud is also a powerful tool for scientific computing, particularly bioinformatics.

Next-gen sequencing, which can produce gigabytes per day, is one factor pushing bioinformatics into the cloud. Data analysis is now the major bottleneck for sequencing-based experiments. Labs are finding out that generating sequencing data is getting to be cheaper than processing it. According to Dave O’Connor Lab at the University of Wisconsin's Department of Pathology and Laboratory Medicine, "There is a real disconnect between the ability to collect next-generation sequence data (easy) and the ability to analyze it meaningfully (hard)."

O'Connor's group works with LabKey Software, a Seattle-based bioinformatics software company founded by the Fred Hutchinson Cancer Research Center. LabKey develops open-source data management software for proteomics, flow cytometry, plate-based assay, and HIV vaccine study data, described in a presentation by Lead Developer Adam Rauch. Their technology stack seems to include: Java, Spring, GWT, Lucene and Gauva (aka Google Collections). LabKey integrates with the impressive Galaxy genomics workflow system and the Trans-Proteomic Pipeline (TPP).

A good part of modern biology boils down to mining biological data, with the goal of correlating sequence, transcription or peptides to outputs like function, phenotype or disease. Machine learning and statistical modeling tend toward long-running CPU-intensive jobs that get run intermittently as new data arrives, making them ideal candidates for the cloud.

Amazon's EC2 seems to be better positioned than either Microsoft's Azure or Google's AppEngine for scientific computing. Amazon has been ahead of the curve in seeing the opportunity in genomic data overload. Microsoft has made some welcome efforts to attract scientific computing, including the Microsoft Biology Foundation and grants for scientific computing in Azure. But they're fighting a headwind arising from proprietary licensing and a closed ecosystem. Oddly, considering Google's reputation for openness, AppEngine looks surprisingly restrictive. Research computing typically involves building and installing binaries, programming in an odd patchwork of languages and long running CPU intensive tasks, none of which is particularly welcome on AppEngine. Maybe Google has a better offering in the works?

It's worth noting that open-source works without friction in cloud environments while many proprietary vendors have been slow to adapt their licensing models to on-demand scaling. For example, lots of folks are using R for machine learning in the cloud, while MatLab is still bogged down in licensing issues. The not-having-to-ask-permission aspect is lost.

According to Xconomy, Seattle has a growing advantage in the cloud. There are several Seattle companies operating in the bioinformatics and cloud spaces. Sage Bionetworks, also linked to FHCRC, was founded by Eric Schadt, also of Pacific Biosciences, and Stephen Friend former founder of Rosetta Inpharmatics. Revolution Analytics sells a scalable variant of R for all kinds of applications including life sciences. Seattle hosts a lot of activity in analytics, cloud computing and biotechnology, which will keep Seattle on the technology map for some time to come.

Sunday, December 12, 2010

Using R for Introductory Statistics, Chapter 4

Chapter 4 of Using R for Introductory Statistics gets us started working with multivariate data. The question is: what are the relationships among the variables? One way to go about answering it is by pairwise comparison of variables. Another technique is to divide the data into categories by the values of some variables and analyze the remaining variables within each category. Different facets of the data can be encoded with color, shape and position to create visualizations that show graphically the relationships between several variables.

Taking variables one or two at a time, we can rely on our previous experience and apply our toolbox of univariate and bivariate techniques, such as histograms, correlation and linear regression.

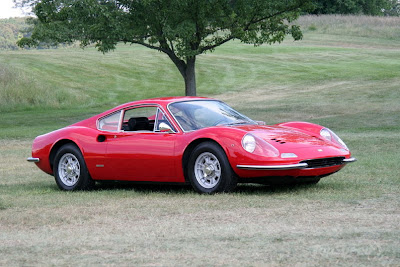
We can also hold some variables constant and analyze the remaining variables in that context. Often, this involves conditioning on a categorical variable, as we did in Chapter 3 by splitting marathon finishing time into gender and age classes. As another example, the distribution of top speeds of italian sports cars describes a dependent variable, top speed, conditioned on two categorical variables, country of origin (Italy) and category (sports car). Because they're so familiar, cars make a great example.

R comes with a dataset called mtcars based on Motor Trend road tests for 32 cars in the 1973-74 model year. They recorded 11 statistics about each model of car. We can get a quick initial look using the pairs function which plots a thumbnail scatterplot for every pair of variables. Pairs is designed to work on numbers, but they've coded categorical values as integers in this data, so it works.

> names(mtcars)
 [1] "mpg"  "cyl"  "disp" "hp"   "drat" "wt"   "qsec" "vs"   "am"   "gear" "carb"
> pairs(mtcars)
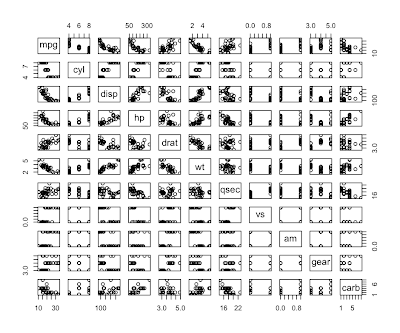
Question 4.7 asks us to describe any trends relating weight, fuel efficiency, and number of cylinders. They also make the distinction between American made cars and imports, another categorical value along with cylinders. Let's make a two-panel plot. First, we'll make a boxplot comparing the distribution of mileage for imports and domestics. In the second panel, we'll combine all four variables.

# make a copy of mtcars 'cause we're going to add a column
cars <- mtcars

# add origin column as a factor to cars data frame
imports <- c(1:3, 8:14, 18:21, 26:28, 30:32)
origin <- rep("domestic", nrow(mtcars))
origin[imports] <- "import"
cars$origin <- factor(origin, levels=c('import', 'domestic'))

# make a vector of colors to color the data points
us.col <- rgb(0,0,255,192, maxColorValue=255)
im.col <- rgb(0,255,0,192, maxColorValue=255)
col <- rep(us.col, nrow(cars))
col[imports] <- im.col

# set up a two panel plot
par(mfrow=c(1,2))
par(mar=c(5,4,5,1)+0.1)

# draw boxplot in first panel
boxplot(mpg ~ origin, data=cars, col=c(im.col, us.col), outpch=19, outcol=c(us.col, im.col), ylab="mpg")
grid(nx=NA, ny=NULL)

# draw scatterplot in second panel
par(mar=c(5,0.5,5,2)+0.1)
plot(mpg~wt, data=cars, col=col, yaxt='n', pch=as.character(cars$cyl), xlab="weight (thousands of lbs)")
grid(nx=NA, ny=NULL)

# fit a line describing mpg as a function of weight
res <- lm(mpg ~ wt, data=cars)
abline(res, col=rgb(255,0,0,64, maxColorValue=255), lty=2)

# return parameters to defaults
par(mar=c(5,4,4,2)+0.1)
par(mfrow=c(1,1))
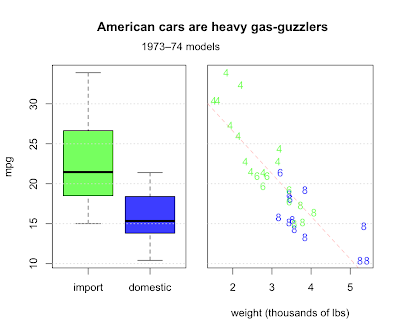
Domestics fair worse, but why? For one thing, the most fuel efficient cars are all light imports with 4 cylinder engines. Domestic cars are heavier with bigger engines and get worse milage. Other factors are certainly involved, but weight does a pretty good job of explaining fuel consumption, with a correlation of almost 87%.

> cor(cars$wt, cars$mpg)
[1] -0.8676594

Of course, fuel economy is not all there is to life on the open road. What about speed? We have quarter mile times, which probably measure acceleration better than top speed. We might hunt for variables that explain quarter mile performance by doing scatterplots and looking for correlation. The single factor that best correlates with qsec is horsepower. But a combination of factors does noticeably better - the power to weight ratio.

rm(origin)
attach(cars)

# transmission type encoded by color
palette <- c("#23809C","#7A1305")
col <- sapply(cars$am, function(x) palette[as.integer(x)+1])

# 5 panels
par(mfrow=c(1,5), omi=c(0,0.6,0.5,0.2))
par(mar=c(5,0.5,4,0.5)+0.1)

# weight
plot(qsec ~ wt, ylab="", xlab="weight", col= col, pch=as.character(cars$cyl))
mtext(sprintf("%.3f",cor(qsec,wt)), side=3)
grid(nx=NA, ny=NULL)

# displacement
plot(qsec ~ disp, ylab="", yaxt='n', xlab="displacement", col= col, pch=as.character(cars$cyl))
mtext(sprintf("%.3f",cor(qsec,disp)), side=3)
axis(2,labels=F, tick=T)
grid(nx=NA, ny=NULL)

# displacement / weight
plot(qsec ~ I(disp/wt), ylab="", yaxt='n', xlab="disp/wt", col= col, pch=as.character(cars$cyl))
mtext(sprintf("%.3f",cor(qsec,disp/wt)), side=3)
axis(2,labels=F, tick=T)
grid(nx=NA, ny=NULL)

# power
plot(qsec ~ hp, ylab="", yaxt='n', xlab="hp", col= col, pch=as.character(cars$cyl))
mtext(sprintf("%.3f",cor(qsec,hp)), side=3)
axis(2,labels=F, tick=T)
grid(nx=NA, ny=NULL)

# power / weight
plot(qsec ~ I(hp/wt), ylab="", yaxt='n', xlab="hp/wt", col= col, pch=as.character(cars$cyl))
mtext(sprintf("%.3f",cor(qsec,hp/wt)), side=3)
axis(2,labels=F, tick=T)
grid(nx=NA, ny=NULL)

# restore defaults
par(mar=c(5,4,4,2)+0.1)
par(mfrow=c(1,1), omi=c(0,0,0,0))

# add titles and legend
title("What factors influence acceleration?")
mtext("quarter mile time in seconds", side=2, padj=-4)
legend(x=88,y=21.5,c('automatic','manual'), fill=palette[c(1,2)], cex=0.6)

detach(cars)
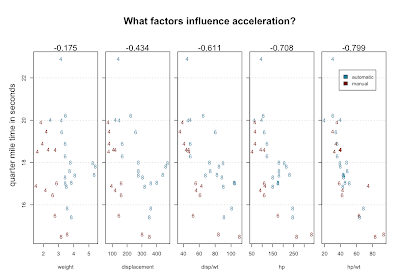
The numbers above the scatterplots are correlation with qsec. Using position, character, color, multi-part graphs and ratios we've managed to visualize 5 variables, which show increasingly good correlation with the variable we're trying to explain.

Here's one theory that might emerge from staring at this data: 4-bangers with automatic transmission are slow. Here's another theory: there's an error in the data. Look at the slow 4 cylinder way at the top. It's quarter mile is nearly three seconds longer than the next slowest car. An outlier like that seems to need an explanation. That car, according to mtcars, is the Mercedes 230. But, the 230 is listed right next to the 240D - D for diesel. The 240D is a solid car. Many are still running. But they're famously slow. What are the odds that the times for these two cars got transposed?

We can check if the data supports our theories about how cars work. For example, we might guess that car makers are likely to put bigger engines in heavier cars to maintain adequate performance at the expense of gas mileage. Comparing weight with numbers of cylinders in the scatterplot above supports this idea. Displacement measures the total volume of the cylinders and that must be closely related to the number of cylinders. Try plot(disp ~ as.factor(cyl), data=mtcars). Displacement and carburetors are big determinants of the horsepower of an engine. Statisticians might be horrified, but try this: plot(hp ~ I(disp * carb), data=mtcars). Multiplying displacement by carburetion is a quick and dirty hack, but in this case, it seems to work out well.

Chapter 4 introduces parts of R's type system, specifically, lists and data.frames, along with subsetting operations and the apply family of functions. I don't go into it here because that was the first thing I learned about R and if you're a programmer, you'll probably want to do the same. One thing the book doesn't cover at all, so far as I can tell, is clustering.

Take a look at the plots above and see if you can't see the cars clustering into familiar categories: the two super-fast sports cars, the three land-yacht luxury cars weighing in at over 5000 pounds a piece, the 8-cylinder muscle cars, and the 4-cylinder econo-beaters. We don't have to do this by eye, because R has several clustering algorithms built in.

Hierarchical clustering (hclust) works by repeatedly merging the two most similar items or existing clusters together. Determining 'most similar' requires a measure of distance. In general, coming up with a good distance metric takes careful thought specific to the problem at hand, but let's live dangerously.

> plot(hclust(dist(scale(mtcars))), main='Hierarchical clustering of cars', sub='1973-74 model year', xlab='Cars', ylab="")
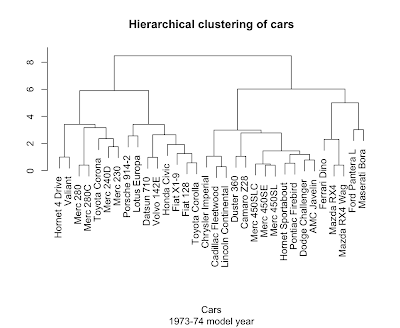
Not bad at all. The scale function helps out here by putting the columns on a common center and scale so the dist function ends up giving equal weight to each variable.

It's easy to analyze the bejeezes out of something you already you already know, like cars. The trick is to get a similar level of insight out of something entirely new.

Links to more...

Saturday, November 27, 2010

Git cheat sheet

I'm trying to wrap my head around Git, Linus Torvalds's complicated but powerful distributed version control system. Here's some quick notes and a wad of links:

Configure

git config --global user.name "John Q. Hacker"
git config --global user.email "jqhacker@somedomain.com"

Start a new empty repository

git init
mkdir fooalicious
cd fooalicious
git init
touch README
git add README
git commit -m 'first commit'
git remote add origin git@github.com:nastyhacks/foo.git
git push -u origin master

Create a local copy of a remote repository

git clone [remote-repository]

Commit to local repository

git commit -a -m "my message"

Review previous commits

git log --name-only

See what branches exist

git branch -v

Switch to a different branch

git checkout [branch you want to switch to]

Create a new branch and switch to it

git checkout -b [name of new branch]

Merge

git merge mybranch

merge the development in the branch "mybranch" into the current branch.

Show remote repositories tracked

git remote -v

Track a remote repository

git remote add --track master origin git@github.com:jqhacker/foo.git

Retrieve from a remote repository

git fetch

Git fetch grabs changes from remote repository and puts it in your repository's object database. It also fetches branches from remote repository and stores them as remote-tracking branches. (see this.)

Fetch and merge from a remote repository

git pull

Push to a remote repository

git push

Pull changes from another fork

git checkout -b otherguy-master master
git fetch https://github.com/otherguy/foo.git master
git merge otherguy-master/master

git checkout master
git merge otherguy-master
git push origin master

Resolve merge conflict in favor of us/them

git checkout --theirs another.txt
git checkout --ours some.file.txt

Diff between local working directory and remote tracking branch

Say you're working with Karen on a project. She adds some nifty features to the source file nifty_files/our_code.py. You'd like to diff your local working copy against hers to see the changes, and prepare to merge them in. First, make sure you have a remote tracking branch for Karen's repo.

git remote add karen git://github.com/karen/our_project.git
git remote -v

The results ought to look something like this:

karen git://github.com/karen/our_project.git (fetch)
karen git://github.com/karen/our_project.git (push)
origin git@github.com:cbare/our_project.git (fetch)
origin git@github.com:cbare/our_project.git (push)

Next, fetch Karen's changes into your local repo. Git can't do a diff across the network, so we have to get a local copy of Karen's commits stored in a remote tracking branch.

git fetch karen

Now, we can do our diff.

git diff karen/master:nifty_files/our_code.py nifty_files/our_code.py

Fixing a messed up working tree

git reset --hard HEAD

return the entire working tree to the last committed state

Shorthand naming

Branches, remote-tracking branches, and tags are all references to commits. Git allows shorthand, so you mostly ever shorthand rather than full names:

  • The branch "test" is short for "refs/heads/test".
  • The tag "v2.6.18" is short for "refs/tags/v2.6.18".
  • "origin/master" is short for "refs/remotes/origin/master".

Links

Monday, November 15, 2010

Tech Industry Gossip

Welcome to the new decade: Java is a restricted platform, Google is evil, Apple is a monopoly and Microsoft are the underdogs

I mostly try to ignore tech industry gossip. But, there's a lot of it, lately. And underlying the shenanigans are big changes in the computing landscape.

First, there's the flurry of lawsuits. This is illustrated nicely by the Economist in The great patent battle. There are several similar graphs of the patent thicket floating around. IP law is increasingly being used as a tool to lock customers in and competitors out. We can expect the (sarcastically named) "Citizens United" ruling on campaign finance to result in more of this particular kind of antisocial behavior.

Google and Facebook are in a pitched battle over your personal data and engineering talent. Google engineers, apparently, are trying to jump over to Facebook prior to what promises to be a huge IPO.

Apple caused quite a kerfuffle by deprecating Java on Mac OS X. After remaining ominously silent for weeks, Oracle seems to have lined up both Apple and IBM behind OpenJDK. Apache Harmony looks to be a casualty of this maneuvering. Harmony, probably not coincidentally, is the basis for parts of Google's Android and Oracle is suing Google over Android's use of Java technology.

Microsoft seems to be waning in importance along with the desktop in general. Ray Ozzie, Chief Architect since 2005, announced that he was leaving, following Robbie Bach of the XBox division and Stephen Elop, now running Nokia. I spoke with one MS marketing guy who said of Ozzie, "Lost him? I'd say we got rid of him!" A lesser noticed departure, that of Jython and Iron Python creator Jim Hugunin may also be telling. Profitable stagnation seems to be the game plan there.

Adobe's been struggling to the point where the NYTimes asked where does Adobe go from here? They took a beating over flash performance and rumors circulated briefly of a buyout by Microsoft.

The cloud is where a lot of the action in software development is moving. Mobile has been growing in importance by leaps and bounds ever since the launch of the iPhone. Cloud computing and consumer devices like smart phones, tablets, and even Kindles are complementary to a certain extent. The economics of cloud computing are hard to argue with. (See James Hamilton's slides and video on data centers.)

Another part of what's changing is a swing of the pendulum away from openness and back towards the walled gardens that most of us thought were left behind in the ashes of Compuserve and AOL. Ironically enough, Apple has become the poster child of walled gardens, with iTunes and the app store. ...the mobile carriers even more so. And the cloud infrastructures of both Microsoft's Azure and (to a lesser degree) Google's App Engine are proprietary. Out of the big 3, Amazon's EC2 is, by far, the most open. Mark Zuckerberg says, "I’m trying to make the world a more open place." But, to Tim Berners-Lee, Facebook and Apple threaten the internet.

There's plenty of money in serving the bulk population. That's why Walmart is so huge. My fear is that in a rush to provide "sugar water" to consumers, the computing industry will neglect the creative people that made the industry so vibrant. But, not to worry. Ray Ozzie's essay Dawn of a new Day does a nice job of putting into perspective the embarrassment of riches that technology has yielded. We're just at the beginning of figuring out what to do with it all.

Tuesday, October 19, 2010

Message queues with Python

A while back, I wanted to build a web front end for a long-running python script. I started with a basic front end using Django. Django is a pleasantly straight-forward web framework, quite similar to Rails, easy to learn (with the help of the excellent and free Django book), and generally trouble-free. Pylons is an alternate choice.

Because the computation was fairly resource intensive, I thought to introduce a queue. The web-app could then concentrate on collecting the necessary input from the user and dumping a job on the queue, leaving the heavy lifting to a worker process (or several). We'd redirect the user to a status page where s/he could monitor progress and get results upon completion. Sounds simple enough, right? I figured my worker processes would look something like this:

big_chunka_data = load_big_chunka_data()
mo_data = load_mo_data()
queue = init_queue("http://myserver.com:12345", "user", "pw", "etc")

while <not-done>:
    try:
        message = queue.block_until_we_can_take_a_message()
        if message says shutdown: shutdown
        big_computation(message['param'],
                        message['foo'],
                        big_chunka_data,
                        mo_data)
    except e:
        log_errors(e)

...and the whole pile-o-junk would look like this:

Start up a handful of workers and a nice load balancing effect comes for free. Slow heavily loaded workers will take fewer jobs, while faster workers take more. I was also hoping for a good answer to the question, "What happens when one of our workers dies?"

Options

There are a ridiculous number of message queues to choose from. I looked at beanstalk which is nice and simple, but its python binding, pybeanstalk seems to be out of date. There's gearman, from Danga the source of memcached. That looked fairly straight forward as well, although be careful to get the newer python binding. Python, itself, now offers the multiprocessing module which has a queue.

One intriguing option is ZeroMQ (aka 0MQ). It's message queueing without a queue. It's brokerless, meaning there's no external queue server process. Messages are routed in common MQ patterns right down at the network level. Of course, if you want store and forward, you're on your own for the persistence part. Still, very cool... Python bindings for ZeroMQ are found in pyzmq.

Several on the seattle python mailing list recommended Celery. After a (superficial) look, Celery seemed too RPC-ish for my taste. I'm probably being up-tight, but when using a queue, I'd rather think in terms of sending a message than calling a function. That seems more decoupled and avoids making assumptions about the structure of the conversation and what's on the other side. I should probably lighten up. Celery is built on top of RabbitMQ, although they support other options.

RabbitMQ and Carrot

RabbitMQ, now part of the SpringSource empire (in turn owned by VMWare), aims to compete with Apache ActiveMQ as a full on enterprise messaging system based on the AMQP spec. I installed RabbitMQ using MacPorts, where you'll notice that RabbitMQ pulls in an absurd amount of dependencies.

sudo port selfupdate
sudo port install rabbitmq-server

For getting python to talk to RabbitMQ, Carrot is a nice option. It was a bit confusing at first, but some nice folks on the carrot-users mailing list set me straight. Apparently, Carrot's author is working on a rewrite called Kombu.

Here's what worked for me. A producer sends Python dictionary objects, which get turned into JSON. My example code is only slightly modified from Creating a Connection in the Carrot documentation. You'll need a little RabbitMQ terminology to understand the connection methods.

  • queues are addresses of receivers
  • exchanges are routers with their own process
  • virtual hosts are the unit of security

Producer

from carrot.connection import BrokerConnection
from carrot.messaging import Publisher

conn = BrokerConnection(hostname="localhost", port=5672,
                          userid="guest", password="guest",
                          virtual_host="/")

publisher = Publisher(connection=conn,
                    exchange="feed", routing_key="importer")

for i in range(30):
   publisher.send({"name":"foo", "i":i})
publisher.close()

The consumers print out the messages as they arrive, then sleep for a bit to simulate long-running tasks. I tested by starting two consumers, one with a longer sleep time. Then I started a producer and saw that the slower consumer got fewer messages, which is what I expected. Note that setting prefetch_count to 1 is necessary to achieve this low-budget load balancing effect.

Consumer

import time
import sys
from carrot.connection import BrokerConnection
from carrot.messaging import Consumer

# supply an integer argument for sleep time to simulate long-running tasks
if (len(sys.argv) > 1):
    sleep_time = int(sys.argv[1])
else:
    sleep_time = 1

connection = BrokerConnection(hostname="localhost", port=5672,
                          userid="guest", password="guest",
                          virtual_host="/")

consumer = Consumer(connection=connection, queue="feed",
                    exchange="feed", routing_key="importer")

def import_feed_callback(message_data, message):
    print "-" * 80
    print message_data
    print message
    message.ack()
    print "-" * 80
    time.sleep(sleep_time)

consumer.register_callback(import_feed_callback)
consumer.qos(prefetch_count=1)

consumer.consume() 
while True: 
    connection.drain_events()

The project remains incomplete and I'm not at all ready to say this is the best way to go about it. It's just the first thing I got working. RabbitMQ seems maybe a little heavy for a simple task queue, but it's also well supported and documented.

It seems like this sort of thing is less mature in the Python world than in Java. It's moving fast though.

Links, links, links

Obsolete note: The version of RabbitMQ in MacPorts (1.7.2) at the time was a version behind and broken. I had to dig through the compiler error log and add a closing paren in line 100 of rabbit_exchange.erl.

Tuesday, October 05, 2010

Economics meets computer science

I saw an interesting lecture by Vijay Vazirani on the cross-over between computer science and economics: The "Invisible Hand of the Market": Algorithmic Ratification and the Digital Economy. Starting with Adam Smith, he covered the development of algorithmic theories of markets and market equilibrium.

The first step was a proof that simple market models have equilibria. A very computational next question, then, is, "OK, these equilibria exist. How hard is it to find them?" Enter complexity theory.

Apparently, algorithmic game theory has been used to derive Equilibrium Pricing of Digital Goods via a New Market Model and was applied to cook up the pricing algorithm for Google's TV ads.

Attempts to compute equilibrium prices led Irving Fisher to develop his "Price Machine" in the early 1890's, which was essentially a hydraulic computer.

Vazirani wrote a book on approximation algorithms. I kept expecting him to introduce the idea that, while finding equilibria is very hard, markets approximate a solution. Maybe, given a set of conditions we could show that the approximation was within certain bounds of the true optimum. But, he didn't.

A few unanswered questions come to mind:

  • Can irrationality be modeled?
  • Do big differences in wealth or other asymmetries illustrate any divergence between the model and the real world?
  • Even if markets reach equilibrium in some theoretical long run, in the real world they're constantly buffeted by exogenous shocks, and therefore disequilibrium must be pretty common. He answered a question like this saying that no attempt to incorporate dynamics has been very successful.
  • Digital marketplaces like eBay or Google's Ad auction must provide a ridiculous treasure trove of data to be mined for empirical economics.

The Q&A session degenerated into politics pretty quickly. People asked about how the financial crisis might have challenged his models. One questioner asked about "animal spirits". Vazirani defended the neoclassical line and stated that their algorithms had "ratified the free market". The questioner responded that "The markets have ratified P.T. Barnum". Another audience member added "...because of government interference". It's surprising that people aren't able to differentiate between a theoretical result based on a carefully constructed model and political opinions in the real world, but that stuff belongs over here.

Monday, October 04, 2010

Worse than linear performance in Rails ActiveRecords with associations

The other day I was doing a task that required iterating through 142 thousand active record objects and computing simple aggregate statistics. Taking convenience over efficiency, I thought I'd just whip up a script to run in a the Ruby on Rails script runner. I usually put little print-line debugging statements in programs like that as a poor man's progress bar. I noticed that as the script ran, it seemed to get slower and slower.

My ActiveRecord abjects are linked up as shown below. The names are changed to protect the guilty, so I might be neglecting something important.

class Basket < ActiveRecord::Base
  has_many :basket_items
  has_many :items, :through => :basket_items
end

class Item < ActiveRecord::Base
  belongs_to :category
  has_many :basket_items
  has_many :baskets, :through => :basket_items
end
Basket.find(:all).each do |basket|
  puts "basket.id = #{basket.id-20000}\t#{Time.now - start_time}" if basket.id % 1000 == 0
end

This part is super fast, 'cause nothing much is done inside the loop other than printing. I don't know exactly how Rails does the conversion from DB fields to objects. That bit seems to be taking place outside the loop. Anyway, what happens if we access the associated items?

counter = 0
Basket.find(:all).each do |basket|
  puts "basket.id = #{basket.id-20000}\t#{Time.now - start_time}" if basket.id % 1000 == 0
  counter += basket.items.length
end

In the second case, we trigger the lazy-load of the list of items. Baskets average 18.7 items. The distribution of item count within the data is more or less random and, on average, flat. Now, we see the timings below.

In other words, this is an nxm operation, but m (the number of items) is more or less constant. I can't guess why this wouldn't be linear. Garbage collection? Should that level off? Maybe, we're just seeing the cost of maintaining the heap? Items are also associated with baskets. Maybe Rails is spending time fixing up that association?

The real script, only a little more complex that the one above, ran in about 30 hours. I realize this is all a little half-baked and I don't intend to chase it down further, but I'm hoping to nerd snipe someone into figuring it out. I'm probably missing a lot and leaving out too much.

Saturday, October 02, 2010

CouchDB and R

Here are some quick crib notes on getting R talking to CouchDB using Couch's ReSTful HTTP API. We'll do it in two different ways. First, we'll construct HTTP calls with RCurl, then move on to the R4CouchDB package for a higher level interface. I'll assume you've already gotten started with CouchDB and are familiar with the basic ReST actions: GET PUT POST and DELETE.

First install RCurl and RJSONIO. You'll have to download the tar.gz's if you're on a Mac. For the second part, we'll need to install R4CouchDB, which depends on the previous two. I checked it out from GitHub and used R CMD INSTALL.

ReST with RCurl

Ping server

getURL("http://localhost:5984/")
[1] "{\"couchdb\":\"Welcome\",\"version\":\"1.0.1\"}\n"

That's nice, but we want to get the result back as a real R data structure. Try this:

welcome <- fromJSON(getURL("http://localhost:5984/"))
welcome$version
[1] "1.0.1"

Sweet!

PUT

One way to add a new record is with http PUT.

bozo = list(name="Bozo", occupation="clown", shoe.size=100)
getURL("http://localhost:5984/testing123/bozo",
       customrequest="PUT",
       httpheader=c('Content-Type'='application/json'),
       postfields=toJSON(bozo))
[1] "{\"ok\":true,\"id\":\"bozo\",\"rev\":\"1-70f5f59bf227d2d715c214b82330c9e5\"}\n"

Notice that RJSONIO has no high level PUT method, so you have to fake it using the costumrequest parameter. I'd never have figured that out without an example from R4CouchDB's source. The API of libCurl is odd, I have to say, and RCurl mostly just reflects it right into R.

If you don't like the idea of sending a put request with a get function, you could use RCurl's curlPerform. Trouble is, curlPerform returns an integer status code rather than the response body. You're supposed to provide an R function to collect the response body text. Not really worth the bother, unless you're getting into some of the advanced tricks described in the paper, R as a Web Client - the RCurl package.

bim <-  list(
  name="Bim", 
  occupation="clown",
  tricks=c("juggling", "pratfalls", "mocking Bolsheviks"))
reader = basicTextGatherer()
curlPerform(
  url = "http://localhost:5984/testing123/bim",
  httpheader = c('Content-Type'='application/json'),
  customrequest = "PUT",
  postfields = toJSON(bim),
  writefunction = reader$update
)
reader$value()

GET

Now that there's something in there, how do we get it back? That's super easy.

bozo2 <- fromJSON(getURL("http://localhost:5984/testing123/bozo"))
bozo2
$`_id`
[1] "bozo"

$`_rev`
[1] "1-646331b58ee010e8df39b5874b196c02"

$name
[1] "Bozo"

$occupation
[1] "clown"

$shoe.size
[1] 100

PUT again for updating

Updating is done by using PUT on an existing document. For example, let's give Bozo, some mad skillz:

getURL(
  "http://localhost:5984/testing123/bozo",
  customrequest="PUT",
  httpheader=c('Content-Type'='application/json'),
  postfields=toJSON(bozo2))

POST

If you POST to the database, you're adding a document and letting CouchDB assign its _id field.

bender = list(
  name='Bender',
  occupation='bending',
  species='robot')
response <- fromJSON(getURL(
  'http://localhost:5984/testing123/',
  customrequest='POST',
  httpheader=c('Content-Type'='application/json'),
  postfields=toJSON(bender)))
response
$ok
[1] TRUE

$id
[1] "2700b1428455d2d822f855e5fc0013fb"

$rev
[1] "1-d6ab7a690acd3204e0839e1aac01ec7a"

DELETE

For DELETE, you pass the doc's revision number in the query string. Sorry, Bender.

response <- fromJSON(getURL("http://localhost:5984/testing123/2700b1428455d2d822f855e5fc0013fb?rev=1-d6ab7a690acd3204e0839e1aac01ec7a",
  customrequest="DELETE"))

CRUD with R4CouchDB

R4CouchDB provides a layer on top of the techniques we've just described.

R4CouchDB uses a slightly strange idiom. You pass a cdb object, really just a list of parameters, into every R4CouchDB call and every call returns that object again, maybe modified. Results are returned in cdb$res. Maybe, they did this because R uses pass by value. Here's how you would initialize the object.

cdb <- cdbIni()
cdb$serverName <- "localhost"
cdb$port <- 5984
cdb$DBName="testing123"

Create

fake.data <- list(
  state='WA',
  population=6664195,
  state.bird='Lady GaGa')
cdb$dataList <- fake.data
cdb$id <- 'fake.data'  ## optional, otherwise an ID is generated
cdb <- cdbAddDoc(cdb)

cdb$res
$ok
[1] TRUE

$id
[1] "fake.data"

$rev
[1] "1-14bc025a194e310e79ac20127507185f"

Read

cdb$id <- 'bozo'
cdb <- cdbGetDoc(cdb)

bozo <- cdb$res
bozo
$`_id`
[1] "bozo"
... etc.

Update

First we take the document id and rev from the existing document. Then, save our revised document back to the DB.

cdb$id <- bozo$`_id`
cdb$rev <- bozo$`_rev`
bozo = list(
  name="Bozo",
  occupation="assassin",
  shoe.size=100,
  skills=c(
    'pranks',
    'honking nose',
    'kung fu',
    'high explosives',
    'sniper',
    'lock picking',
    'safe cracking'))
cdb <- cdbUpdateDoc(bozo)

Delete

Shortly thereafter, Bozo mysteriously disappeared.

cdb$id = bozo$`_id`
cdb <- cdbDeleteDoc(cdb)

More on ReST and CouchDB

  • One issue you'll probably run into is that unfortunately JSON left out NaN and Infinity. And, of course only R knows about NAs.
  • One-off ReST calls are easy using curl from the command line, as described in REST-esting with cURL.
  • I flailed about quite a bit trying to figure out the best way to do HTTP with R.
  • I originally thought R4CouchDB was part of a Google summer of code project to support NoSQL DBs in R. Dirk Eddelbuettel clarified that R4CouchDB was developed independently. In any case, the schema-less approach fits nicely with R's philosophy of exploratory data analysis.

Monday, September 27, 2010

How to send an HTTP PUT request from R

I wanted to get R talking to CouchDB. CouchDB is a NoSQL database that stores JSON documents and exposes a ReSTful API over HTTP. So, I needed to issue the basic HTTP requests: GET, POST, PUT, and DELETE from within R. Specifically, to get started, I wanted to add documents to the database using PUT.

There's CRAN package called httpRequest, which I thought would do the trick. This wound up being a dead end. There's a better way. Skip to the RCurl section unless you want to snicker at my hapless flailing.

Stuff that's totally beside the point

As Edison once said, "Failures? Not at all. We've learned several thousand things that won't work."

The httpRequest package is very incomplete, which is fair enough for a package at version 0.0.8. They implement only basic get and post and multipart post. Both post methods seem to expect name/value pairs in the body of the POST, whereas accessing web services typically requires XML or JSON in the request body. And, if I'm interpreting the HTTP spec right, these methods mishandle termination of response bodies.

Given this shaky foundation to start with, I implemented my own PUT function. While I eventually got it working for my specific purpose, I don't recommend going that route. HTTP, especially 1.1, is a complex protocol and implementing it is tricky. As I said, I believe the httpRequest methods, which send HTTP/1.1 in their request headers, get it wrong.

Specifically, they read the HTTP response with a loop like one of the following:

repeat{
  ss <- read.socket(fp,loop=FALSE)
  output <- paste(output,ss,sep="")
  if(regexpr("\r\n0\r\n\r\n",ss)>-1) break()
  if (ss == "") break()
}
repeat{
 ss <- rawToChar(readBin(scon, "raw", 2048))
 output <- paste(output,ss,sep="")
 if(regexpr("\r\n0\r\n\r\n",ss)>-1) break()
 if(ss == "") break()
 #if(proc.time()[3] > start+timeout) break()
}

Notice that they're counting on a blank line, a zero followed by a blank line or the server closing the connection to signal the end of the response body. I dunno where the zero thing comes from or why we should count on it not being broken up during reading. Looking through RFC2616 we find this description of an HTTP message:

generic-message = start-line
                  *(message-header CRLF)
                  CRLF
                  [ message-body ]

While the headers section ends with a blank line, the message body is not required to end in anything in particular. The part of the spec that refers to message length lists 5 ways that a message may be terminated, 4 of which are not "server closes connection". None of them are "a blank line". HTTP 1.1 was specifically designed this way so web browsers could download a page and all its images using the same open connection.

For my PUT implementation, I fell back to HTTP 1.0, where I could at least count on the connection closing at the end of the response. Even then, socket operations in R are confusing, at least for the clueless newbie such as myself.

One set of socket operations consists of: make.socket, read.socket/write.socket and close.socket. Of these functions, the R Data Import/Export guide states, "For new projects it is suggested that socket connections are used instead."

OK, socket connections, then. Now we're looking at: socketConnection, readLines, and writeLines. Actually, tons of IO methods in R can accept connections: readBin/writeBin, readChar/writeChar, cat, scan and the read.table methods among others.

At one point, I was trying to use the Content-Length header to properly determine the length of the response body. I would read the header lines using readLines, parse those to find Content-Length, then I tried reading the response body with readChar. By the name, I got the impression that readChar was like readLines but one character at a time. According to some helpful tips I got on the r-help mailing list this is not the case. Apparently, readChars is for binary mode connections, which seems odd to me. I didn't chase this down any further, so I still don't know how you would properly use Content-Length with the R socket functions.

Falling back to HTTP 1.0, we can just call readLines 'til the server closes the connection. In an amazing, but not recommended, feat of beating a dead horse until you actually get somewhere, I finally came up with the following code, with a couple variations commented out:

http.put <- function(host, path, data.to.send, content.type="application/json", port=80, verbose=FALSE) {

  if(missing(path))
    path <- "/"
  if(missing(host))
    stop("No host URL provided")
  if(missing(data.to.send))
    stop("No data to send provided")

  content.length <- nchar(data.to.send)

  header <- NULL
  header <- c(header,paste("PUT ", path, " HTTP/1.0\r\n", sep=""))
  header <- c(header,"Accept: */*\r\n")
  header <- c(header,paste("Content-Length: ", content.length, "\r\n", sep=""))
  header <- c(header,paste("Content-Type: ", content.type, "\r\n", sep=""))
  request <- paste(c(header, "\r\n", data.to.send), sep="", collapse="")

  if (verbose) {
    cat("Sending HTTP PUT request to ", host, ":", port, "\n")
    cat(request, "\n")
  }

  con <- socketConnection(host=host, port=port, open="w+", blocking=TRUE, encoding="UTF-8")
  on.exit(close(con))

  writeLines(request, con)

  response <- list()

  # read whole HTTP response and parse afterwords
  # lines <- readLines(con)
  # write(lines, stderr())
  # flush(stderr())
  # 
  # # parse response and construct a response 'object'
  # response$status = lines[1]
  # first.blank.line = which(lines=="")[1]
  # if (!is.na(first.blank.line)) {
  #   header.kvs = strsplit(lines[2:(first.blank.line-1)], ":\\s*")
  #   response$headers <- sapply(header.kvs, function(x) x[2])
  #   names(response$headers) <- sapply(header.kvs, function(x) x[1])
  # }
  # response$body = paste(lines[first.blank.line+1:length(lines)])

  response$status <- readLines(con, n=1)
  if (verbose) {
    write(response$status, stderr())
    flush(stderr())
  }
  response$headers <- character(0)
  repeat{
    ss <- readLines(con, n=1)
    if (verbose) {
      write(ss, stderr())
      flush(stderr())
    }
    if (ss == "") break
    key.value <- strsplit(ss, ":\\s*")
    response$headers[key.value[[1]][1]] <- key.value[[1]][2]
  }
  response$body = readLines(con)
  if (verbose) {
    write(response$body, stderr())
    flush(stderr())
  }

  # doesn't work. something to do with encoding?
  # readChar is for binary connections??
  # if (any(names(response$headers)=='Content-Length')) {
  #   content.length <- as.integer(response$headers['Content-Length'])
  #   response$body <- readChar(con, nchars=content.length)
  # }

  return(response)
}

After all that suffering, which was undoubtedly good for my character, I found an easier way.

RCurl

Duncan Temple Lang's RCurl is an R wrapper for libcurl, which provides robust support for HTTP 1.1. The paper R as a Web Client - the RCurl package lays out a strong case that wrapping an existing C library is a better way to get good HTTP support into R. RCurl works well and seems capable of everything needed to communicate with web services of all kinds. The API, mostly inherited from libcurl, is dense and a little confusing. Even given the docs and paper for RCurl and the docs for libcurl, I don't think I would have figured out PUT.

Luckily, at that point I found R4CouchDB, an R package built on RCurl and RJSONIO. R4CouchDB is part of a Google Summer of Code effort, NoSQL interface for R, through which high-level APIs were developed for several NoSQL DBs. Finally, I had stumbled across the answer to my problem.

I'm mainly documenting my misadventures here. In the next installment, CouchDB and R we'll see what actually worked. In the meantime, is there a conclusion from all this fumbling?

My point if I have one

HTTP is so universal that a high quality implementation should be a given for any language. HTTP-based APIs are being used by databases, message queues, and cloud computing services. And let's not forget plain old-fashioned web services. Mining and analyzing these data sources is something lots of people are going to want to do in R.

Others have stumbled over similar issues. There are threads on r-help about hanging socket reads, R with CouchDB, and getting R to talk over Stomp.

RCurl gets us pretty close. It could use high-level methods for PUT and DELETE and a high-level POST amenable to web-service use cases. More importantly, this stuff needs to be easier to find without sending the clueless noob running down blind alleys. RCurl is greatly superior to httpRequest, but that's not obvious without trying it or looking at the source. At minimum, it would be great to add a section on HTTP and web-services with RCurl to the R Data Import/Output guide. And finally, take it from the fool: trying to role your own HTTP (1.1 especially) is a fool's errand.

Thursday, September 23, 2010

Geting started with CouchDB

I'm investigating using CouchDB for a data mining application. CouchDB is a schema-less document-oriented database that stores JSON documents and uses JavaScript as a query language. You write queries in the form of map-reduce. Applications connect to the database over a ReSTful HTTP API. So, Couch is a creature of the web in a lot of ways.

What I have in mind (eventually) is sharding a collection of documents between several instances of CouchDB each running on their own nodes. Then, I want to run distributed map-reduce queries over the whole collection of documents. But, I'm just a beginner, so we're going to start off with the basics. The CouchDB wiki has a ton of getting started material.

Couchdb's installation instructions cover several options for installing on Mac OS X, as well as other OS's. I used MacPorts.

sudo port selfupdate
sudo port install couchdb

Did I remember to update my port definitions the first time through? Of f-ing course not. Port tries to be helpful, but it's a little late sometimes with the warnings. Anyway, now that it's installed, let's start it up. I came across CouchDB on Mac OS 10.5 via MacPorts which tells you how to start CouchDB using Apple's launchctl.

sudo launchctl load /opt/local/Library/LaunchDaemons/org.apache.couchdb.plist
sudo launchctl start org.apache.couchdb

To verify that it's up and running, type:

curl http://localhost:5984/

...which should return something like:

{"couchdb":"Welcome","version":"1.0.1"}

Futon, the web based management tool for CouchDB can be browsed to at http://localhost:5984/_utils/.

Being a nerd, I tried to run Futon's test suite. After they failed, I found this: The tests run only(!) in a separate browser and that browser needs to be Firefox. Maybe that's been dealt with by now.

Let's create a test database and add some bogus records like these:

{
   "_id": "3f8e4c80b3e591f9f53243bfc8158abf",
   "_rev": "1-896ed7982ecffb9729a4c79eac9ef08a",
   "description": "This is a bogus description of a test document in a couchdb database.",
   "foo": true,
   "bogosity": 99.87526349
}

{
   "_id": "f02148a1a2655e0ed25e61e8cee71695",
   "_rev": "1-a34ffd2bf0ef6c5530f78ac5fbd586de",
   "foo": true,
   "bogosity": 94.162327,
   "flapdoodle": "Blither blather bonk. Blah blabber jabber jigaboo splat. Pickle plop dribble quibble."
}

{
   "_id": "9c24d1219b651bfeb044a0162857f8ab",
   "_rev": "1-5dd2f82c03f7af2ad24e726ea1c26ed4",
   "foo": false,
   "bogosity": 88.334,
   "description": "Another bogus document in CouchDB."
}

When I first looked at CouchDB, I thought Views were more or less equivalent to SQL queries. That's not really true in some ways, but I'll get to that later. For now, let's try a couple in Futon. First, we'll just use a map function, no reducer. Let's filter our docs by bogosity. We want really bogus documents.

Map Function

function(doc) {
  if (doc.bogosity > 95.0)
    emit(null, doc);
}

Now, let's throw in a reducer. This mapper emits the bogosity value for all docs. The reducer takes their sum.

Map Function

function(doc) {
  emit(null, doc.bogosity);
}

Reduce Function

function (key, values, rereduce) {
  return sum(values);
}

It's a fun little exercise to try and take the average. That's tricky because, for example, ave(ave(a,b), ave(c)) is not necessarily the same as ave(a,b,c). That's important because the reducer needs to be free to operate on subsets of the keys emitted from the mapper, then combine the values. The wiki doc Introduction to CouchDB views explains the requirements on the map and reduce functions. There's a great interactive emulator and tutorial on CouchDB and map-reduce that will get you a bit further writing views.

One fun fact about CouchDB's views is that they're stored in CouchDB as design documents, which are just regular JSON like everything else. This is in contrast to SQL where a query is a completely different thing from the data. (OK, yes, I've heard of stored procs.)

That's the basics. At this point, a couple questions arise:

  • How do you do parameterized queries? For example, what if I wanted to let a user specify a cut-off for bogosity at run time?
  • How do I more fully get my head around these map-reduce "queries"?
  • Can CouchDB do distributed map-reduce like Hadoop?

There's more to design documents than views. Both _show and _list functions let you transform documents. List functions use cursor-like iterator that enables on-the-fly filtering and aggregating as well. Apparently, there are plans for _update and _filter functions as well. I'll have to do some more reading and hacking and leave those for later.

Links

Tuesday, August 31, 2010

Probability processor

MIT's Technology Review reports on A New Kind of Microchip, a probability-based processor designed to speed up statistical computations.

The chip works with electrical signals that represent probabilities, instead of 1s and 0s using building blocks known as Bayesian NAND gates. “Whereas a conventional NAND gate outputs a "1" if neither of its inputs match, the output of a Bayesian NAND gate represents the odds that the two input probabilities match. This makes it possible to perform calculations that use probabilities as their input and output.”

“This is not digital computing in the traditional sense,” says Ben Vigoda, founder of Lyric Semiconductor. “We are looking at processing where the values can be between a zero and a one.” (from Wired article Probabilistic Chip Promises Better Flash Memory, Spam Filtering) Vigoda's Analog Logic: Continuous-Time Analog Circuits for Statistical Signal Processing probably spells it all out, if you've got the fortitude to read it. For us light-weights, there's a video Lyric Semiconductor explains its probability chip. It's super-cool that he mentions genomics as a potential application.

Computing has been steadily moving towards more specialized coprocessors, for example the vector capabilities of graphics chips (GPU's). Wouldn't it be neat to have a stats coprocessor alongside your general purpose CPU? (Or inside it like an FPU?) How about a cell processor configuration where you'd get an assortment of CPU cores, graphic/vector GPU cores and probability processor cores?

Saturday, August 21, 2010

Using R for Introductory Statistics, Chapter 3.4

...a continuing journey through Using R for Introductory Statistics, by John Verzani.

Simple linear regression

Linear regression is a kooky term for fitting a line to some data. This odd bit of terminology can be blamed on Sir Francis Galton, a prolific victorian scientist and traveler who saw it as related to his concept of regression toward the mean. Calling it a linear model is a little more straight-forward, and linear modeling through the lm function is bread-and-butter to R.

For example, let's look at the data set diamonds to see if there's a linear relationship between weight and cost of diamonds.

f = price ~ carat
plot(f, data=diamond, pch=5,
     main="Price of diamonds predicted by weight")
res = lm(f, data=diamond)
abline(res, col='blue')

We start by creating the formula f using the strange looking tilde operator. That tells the R interpreter that we're defining a symbolic formula, rather than an expression to be evaluated immediately. So, our definition of formula f says, "price is a function of carat". In the plot statement, the formula is evaluated in the context given by data=diamond, so that the variables in our formula have values. That gives us the scatter plot. Now let's fit a line using lm, context again given by data=diamond, and render the resulting object as a line using abline. Looks spiffy, but what just happened?

The equation of a line that we learned in high school is:

Minimizing squared error over our sample gives us estimates of the slope and intercept. The book presents this without derivation, which is a shame.


Maybe later, I'll get brave an try to insert a derivation here.

Examples

There's a popular linear model that applies to dating, which goes like this: It's OK for a man to date a younger woman if her age is at least half the man's age plus seven. In other words, this:

Apparently, I should be dating a 27 year old. Let me go ask my wife if that's OK. In the meantime, let's see how our rule compares to results of a survey asking the proper cutoff for dating for various ages.

plot(jitter(too.young$Male), jitter(too.young$Female),
     main="Appropriate ages for dating",
     xlab="Male age", ylab="Female age")
abline(7,1/2, col='red')
res <- lm(Female ~ Male, data=too.young)
abline(res, col='blue', lty=2)
legend(15,45, legend=c("half plus 7 rule",
       "Estimated from survey data"),
       col=c('red', 'blue'), lty=c(1,2))

That's a nice correspondence. On second thought, this is statistical proof that my daughter is not allowed to leave the house 'til she's 30.

Somehow related to that is the data set Animals, comparing weights of body and brain for several animals. The basic scatterplot not revealing much, we put the data on a log scale and find that it looks much better. As near as I can tell, the I or AsIs function does something like the opposite of the tilde operator. It tells the interpreter to go ahead and evaluate the enclosed expression. The general gist is to transform our data to log scale then apply linear modeling.

f = I(log(brain)) ~ I(log(body))
plot(f, data=Animals,
     main="Animals: brains vs. bodies",
     xlab="log body weight", ylab="log brain weight")
res = lm(f, data=Animals)
abline(res, col='brown')

Now the problem is, the line doesn't seem to fit very well. Those three outliers on the right edge have high body weights but less than expected going on upstairs. That seems to unduly influence the linear model away from the main trend. R contains some alternative algorithms for fitting a line to data. The function lqs is more resistant to outliers, like the large but pea-brained creatures in this example.

res.lqs = lqs(f, data=Animals)
abline(res.lqs, col='green', lty=2)

That's better. Finally, you might use identify to solve the mystery of the knuckleheaded beasts.

with(Animals, identify(log(body), log(brain), n=3, labels=rownames(Animals)))

Problem 3.31 is about replicate measurements, which might be a good idea where measurement error, noisy data, or other random variation is present. We follow the by now familiar procedure of defining our formula, doing a scatterplot, building our linear model, and finally plotting it over the scatterplot.

We are then asked to look at the variance of measurements at each particular voltage. To do that, we'll first split our data.frame up by voltage. The result is a list of vectors, one per voltage level.

breakdown.by.voltage = split(breakdown$time, breakdown$voltage)
str(breakdown.by.voltage)
List of 7
 $ 26: num [1:3] 5.8 1580 2323
 $ 28: num [1:5] 69 108 110 426 1067
 $ 30: num [1:11] 7.7 17 20 21 22 43 47 139 144 175 ...
 $ 32: num [1:15] 0.27 0.4 0.69 0.79 2.75 3.9 9.8 14 16 27 ...
 $ 34: num [1:19] 0.19 0.78 0.96 1.31 2.78 3.16 4.15 4.67 4.85 6.5 ...
 $ 36: num [1:15] 0.35 0.59 0.96 0.99 1.69 1.97 2.07 2.58 2.71 2.9 ...
 $ 38: num [1:7] 0.09 0.39 0.47 0.73 1.13 1.4 2.38

Next, let's compute the variance for each component of the above list and build a data.frame out of it.

var.by.voltage = data.frame(voltage=names(breakdown.by.voltage),
                            variance=sapply(breakdown.by.voltage,
                            FUN=var))

This split-apply-combine pattern looks familiar. It's basically a SQL group by in R. It's also the basis for Hadley Wickham's plyr library. Plyr's ddply function takes breakdown, a data.frame, and splits it on values of the voltage column. For each part, it computes the variance in the time column, then assembles the results back into a data.frame.

ddply(breakdown, .(voltage), .fun=function(df) {var(df$time)})

While that's not directly related to linear modeling, this kind of exploratory data manipulation is what R is made for.

More fun

Previous episode of Using R for Introductory Statistics

Wednesday, August 11, 2010

Using R for Introductory Statistics 3.3

...continuing our way though John Verzani's Using R for introductory statistics. Previous installments: chapt1&2, chapt3.1, chapt3.2

Relationships in numeric data

If two data series have a natural pairing (x1,y1),...,(xn,yn), then we can ask, “What (if any) is the relationship between the two variables?” Scatterplots and correlation are first-line ways of assessing a bivariate data set.

Pearson's correlation

The Pearson's correlation coefficient is calculated by dividing the covariance of the two variables by the product of their standard deviations. It ranges from 1 for perfectly correlated variables to -1 for perfectly anticorrelated variables. 0 means uncorrelated. Independent variables have a correlation coefficient close to 0, but the converse is not true because the correlation coefficient detects only linear dependencies between two variables. [see wikipedia entry on correlation]

Question 3.19 concerns a sampling of 1000 New York Marathon runners. We're asked whether we expect a correlation between age and finishing time.

attach(nym.2002)
cor(age, time)
[1] 0.1898672
cor(age, time, method="spearman")
0.1119944

We discover a low correlation - good news for us wheezing old geezers. A scatterplot might show something. And we have the gender of each runner, so let's use that, too.

First, let's set ourselves up for a two panel plot.

par(mfrow=c(2,1))
par(mar=c(2,4,4,2)+0.1)

Next let's set up colors - pink for ladies, blue for guys - and throw in some transparency because a lot of data points are on top of each other.

blue = rgb(0,0,255,64, maxColorValue=255)
pink = rgb(255,192,203,128, maxColorValue=255)

color <- rep(blue, length(gender))
color[gender=='Female'] <- pink

In the first panel, draw the scatter plot.

plot(time, age, col=color, pch=19, main="NY Marathon", ylim=c(18,80), xlab="")

And in the second panel, break it down by gender. It's a well kept secret that outcol and outpch can be used to set the color and shape of the outliers in a boxplot.

par(mar=c(5,4,1,2)+0.1)
boxplot(time ~ gender, horizontal=T, col=c(pink, blue), outpch=19, outcol=c(pink, blue), xlab="finishing time (minutes)")

Now return our settings to normal for good measure.

par(mar=c(5,4,4,2)+0.1)
par(mfrow=c(1,1))

Sure enough, there doesn't seem to be much correlation between age and finishing time. Gender has an effect, although I'm sure the elite female runners would have little trouble dusting my slow booty off the trail.

It looks like we have fewer data points for women. Let's check that. We can use table to count the number of times each level of a factor occurs, or in other words, count the number of males and females.

table(gender)
gender
Female   Male 
   292    708

I'm still a little skeptical of our previous result - the low correlation between age and finishing time. Let's look at the data binned by decade.

bins <- cut(age, include.lowest=T, breaks=c(20,30,40,50,60,70,100), right=F, labels=c('20s','30s','40s','50s','60s','70+'))
boxplot(time ~ bins, col=colorRampPalette(c('green','yellow','brown'))(6), ylim=c(570,140))

It looks like you're not washed up as a runner until your 50's. Things go down hill from there, but, it doesn't look very linear, so we shouldn't be too surprised about our low r.

Coarser bins, old and young using 50 as our cut-off, reveal that there's really no correlation in the younger group. In the older group, we're starting to see some correlation. I suppose you could play with the numbers to find an optimum cut-off that maximized the difference in correlation. Not sure what the point of that would be.

y <- nym.2002[age<50,]
cor(y$age,y$time)
[1] -0.01148919
cor(y$age,y$time, method='spearman')
[1] -0.01512368
o <- nym.2002[age>=50,]
cor(o$age, o$time)
[1] 0.3813543
cor(o$age, o$time, method='spearman')
[1] 0.1980635

I ran a marathon once in my life. I think I was 30 and my time was a pokey 270 or so. My knees hurt for days afterwards, so I'm not sure I'd try it again. I do want to do a half, though. Gotta get back in shape for that...

More on Using R for Introductory Statistics