Showing posts with label Bioinformatics. Show all posts

Tuesday, November 11, 2014

The DREAM / RECOMB Conference 2014

The RECOMB/ISCB Conference on Regulatory and Systems Genomics, with DREAM Challenges and Cytoscape Workshops is running this week in San Diego.

A bunch of us from Sage Bionetworks are here to connect with the DREAM community. In introductory remarks, Stephen Friend framed the challenges as piloting new modes of collaboration and engagement addressing multidimensional problems based on the idea that open innovation will trump closed silos.

Lincoln Stein: The Future of Genomic Databases

I first heard Lincoln Stein speak at an O'Reilly conference in 2002, on building a bioinformatics nation. The same themes of openness and integration reappeared in Stein's talk on The Future of Genomic Databases.

Stein asks, "Open Data + open source = reproducible science?" Not exactly. Stein presents some emerging solutions to the remaining obstacles: big data sets, complex workflows, unportable code and data access restrictions.

Cloud computing, specifically colocation of data and compute, enables handling big data. Containers (ie Docker) address the problem of code portability. The Global Alliance is working towards providing APIs both to encapsulate technical complexity and to provide a control point at which to enforce restrictions.

In case we're wondering what to do with all the machine cycles made available by Amazon and Google, bioinformatics workflows are growing in complexity. Workflow managers like Seqware and Galaxy provide a formalized description of multistep processes and manage tools and their dependencies.

Legal restrictions hinder data integration. But, donors want their samples to contribute to research. Licensure for data access combined with uniform consent could reduce the friction resulting in a streamlined data access process. On the other hand, technical solutions involve homomorphic encryption and agent based federated queries.

As a parting thought, Stein notes that digital infrastructure enables experiments in incentive structures and economic models, citing micropayments, ratings, and challenges.

Andrea Califano

Andrea Califano spoke on the genotype to phenotype linkage in cancer. Thinking of the cell as an integrator of signals, Califo's group traces from gene or protein expression signatures of cell states (normal, neoplastic, metastatic) back through the network to the master regulators responsible for that signature. One related paper is Identification of Causal Genetic Drivers of Human Disease through Systems-Level Analysis of Regulatory Networks.

Paul Boutros Somatic Mutation Calling Challenge

Paul Boutros presented the Somatic Mutation Calling Challenge (SMC-DNA). He announced the intention for the SMC challenges to become a living benchmark, an objective standard against which future methods will be tested.

Paul also crowned the Broad Institute's MuTect (single nucleotide) and novoBreak (structural variants) by Ken Chen's lab at MD Anderson the winners of the synthetic tumor phase of SMC-DNA. The plan is to announce winners on real tumor data in February after experimental validation.

The Winners

The SMC challenge is a bit unique for DREAM in its level of specialization. In the other challenge, a couple of methods were highlighted: Gaussian process regression and dictionary learning for sparse representation.

But, increasingly, the main differentiator is application of biological domain knowledge, especially with respect to selecting and processing features. Li Liu of Arizona State's Biodesign Institute, for example, won part of the Accute Myoloid Leukemia challenge by weighting proteins based on their evolutionary conservation.

Another theme is that genetic features seem to have poor signal compared to more downstream features, gene expression or clinical variables. Peddinti Gopalacharyulu, a top performer in the Gene Essentiality Challenge, commented that perhaps the way to use genetics is to extract the component of gene expression that is not explained by genetic features.

DREAM 9.5

Two of the Dream 9.5 challenges are follow-ups to the Somatic Mutation Calling challenge from the 8.5 round. The SMC empire expands into RNA and tumor heterogeneity. In the olfaction challenge, the goal is to predict, from molecular features, odor as described by human subjects. The Prostate cancer challenge asks participants to classify patients according to survival using data sourced from the comparator arms of clinical trials.

For the DREAM 10 round, there's an imaging challenge in the works and a sequel to the ALS challenge challenge from DREAM 7.

On to RECOMB

That's just the DREAM part of the meeting, or, really, the subset that fit into my brain. As an added bonus, there were several representatives from Cytoscape-related projects and some conversation about the Global Alliance for Genomics and Health.

Thursday, July 03, 2014

Galaxy Community Conference

The 2014 Galaxy Community Conference (GCC2014) wrapped up yesterday at Johns Hopkins University in Baltimore. The best part for me was the pre-conference hackathon.

If you're not familiar with Galaxy, it's a framework for wrapping command line bioinformatics tools in a web UI. On top of that, Galaxy adds lots of sophistication around job scheduling, configurable to run its job on SGE, SLURM, and other queuing systems and to run on virtual clusters with Cloudman. Galaxy users can design reproducible workflows and manage tool versioning and dependencies through the Toolshed.

The project has attracted a vibrant community supported by an active Q&A site and an IRC channel. Vendors offer Galaxy appliances, cloud deployments and consulting.

Hackathon

For the hackathon, 40 developers gathered in James Taylor's new computing lab in one of the red brick buildings interspersed with lawns and groves of trees that make up the Hopkins campus. This was a great setting for an accelerated ramp-up on the Galaxy codebase. Out of 18 proposed projects, 9 got far enough to be called finished. I learned how to write tool wrappers and how to access the Galaxy API.

Photo credit - someone on the Galaxy team

Galaxy + Synapse

Specifically, I was there to put together some integration between Synapse and Galaxy, bulding on what Kyle Ellrott had already started. Reproducibile analysis, provenance and annotation are core concerns of both projects, so it seems like a good fit. After data exchange, which Kyle got working, exchanging provenance and metadata sound like logical next steps.

Galaxy histories should be able to refer to Synapse entities and receive annotations along with data objects.

Serializing Galaxy histories, workflows etc. out to Synapse might allow a usage model where a cloud instances of Galaxy can be spun up and shut down on demand, with all the important details preserved in Synapse in between times.

Portable provenance might be a longer term goal. It would be neat to be able to thread provenance through some arbitrary combination of data sources and analysis platforms. All of these provenance-aware platforms - Figshare, Dryad, Synapse, Arvados, Galaxy, etc - ought to be able to share provenance between themselves.

Next year

The whole event was well put together in general. Next year's Galaxy Community Conference is scheduled for 6-8 July 2015 in Norwich, England.

Wednesday, December 11, 2013

DREAM conference

Apparently, live-blogging isn't my thing. This post has been sitting on my desktop getting stale for entirely too long...

I'm just back (a month ago) from the conference for the DREAM challenges in Toronto. It was great to see the Dream 8 challenges wrap up and another round of challenges get under way. Plus, I think my IQ went up a few points just by standing in a room full of smart people applying machine learning to better understand biology.

The DREAM organization, led by Gustavo Stolovitzky, partnered with Sage Bionetworks to host the challenges on the Synapse platform. Running the challenges involves a surprising amount of logistics and the behind-the-scenes labor of many to pose a good question, data collection and preparation, provide clear instructions, and evaluate submissions. Puzzling out how to score submissions can be a data analysis challenge in it's own right.

HPN

The winners of the Breast Cancer Network Inference Challenge applied a concept from economics called Granger Causality. I have a thing for ideas that cross over from one domain to another, especially between economics to biology. The team, from Josh Stuart's lab at UCSC calls their algorithm Prophetic Granger Causality, which they combined with data from Pathway commons to infer signaling pathways from time-series proteomics data taken from breast cancer cell lines.

The visualization portion of the same challenge was swept by Amina Qutub's lab at Rice University with their stylish BioWheel visualization based on Circos. Qutub showed a prototype of a D3 re-implementation. I'm told that availability of source code is coming soon. There's a nice write-up Qutub bioengineering lab builds winning tool to visualize protein networks and a video.

BioWheel from Team ABCD writeup

Whole-cell modeling

In the whole-cell modeling challenge, led by Markus Covert of Stanford University, participants were tasked with estimating the model parameters for specific biological processes from a simulated microbial metabolic model.

Since synthetic data is cheap, a little artificial scarcity was introduced by giving participants a budget with which they could purchase data of several different types. Using this data budget wisely then becomes an interesting part of the challenge. One thing that's not cheap is running these models. That part was handled by BitMill a distributed computing platform developed by Numerate and presented by Brandon Allgood.

Making hard problems accessible to outsiders with new perspectives is a big goal of organizing a challenge. One of the winners of this challenge, a student in a neuroscience lab at Brandice, is a great example. They're condidering a second round for this challenge next year.

Toxicogenetics

Yang Xie's lab at UT SouthWestern's QBRC added another win to their collection in the Toxicogenetics challenge. Tao Wang revealed some of their secrets in his presentation.

From Tao Wang's slides

Wang explained that their approach relies on extensive exploratory analysis, careful feature selection, dimensionality reduction, and rigorous cross-validation.

Keynotes

Trey Ideker presented a biological ontology comparable in some ways to GO called NeXO for Network Extracted Ontology. The important difference is this: whereas GO is human curated from literature, NeXO is derived from data. There's a paper, A gene ontology inferred from molecular networks, and a slick looking NeXO web application.

Tim Hughes gave the other keynote on RNA-binding motifs complementing prior work constructing RBPDB, a database of RNA-binding specificities.

DREAM 8.5

Since the next round of challenges is coming sooner than DREAM's traditional yearly cycle, it's numbered 8.5. There are three challenges that are getting underway now:

Discussion

During the discussion session, questions were raised about on whether to optimize the design of the challenges to produce generalizable methods or for answering a specific biological question. Domain knowledge can give competitors advantages in terms of understanding noise characteristics and artifacts in addition to informing realistic assumptions. If the goal is strictly to compare algorithms, this might be a bug. But in the context of answering biological questions, it's a feature.

Support was voiced for data homogeneity (No NAs, data plus quality/confidence metric) and more realtime feedback.

It takes impressive community management skills to maintain a balance that appeals to a diverse array of talent as well as providers of data and support.

Tuesday, June 25, 2013

The Dream 8 Challenges

The 8th iteration of the DREAM Challenges are underway.

DREAM is something like the Kaggle of computational biology with an open science bent. Participating teams apply machine learning and statistical modeling methods to biological problems, competing to achieve the best predictive accuracy.

This year's three challenges focus on reverse engineering cancer, toxicology and the kinetics of the cell.

Sage Bionetworks (my employer) has teamed up with DREAM to offer our Synapse platform as an integral part of the challenges. Synapse is targeted at providing a platform for hosting data analysis projects, much like GitHub is a platform for software development projects.

My own part in Synapse is on the Python client and a bit on the R client. I expect to get totally pummeled by bug reports once participation in the challenges really gets going.

Open data, collaborative innovation and reproducible science

The goal of Synapse is to enable scientists to combine data, source code, provenance, prose and figures to tell a story with data. The emphasis is on open data and collaboration, but full access control and governance for restricted access is built in.

In contrast to Kaggle, the DREAM Challenges are run in the spirit of open science. Winning models become part of the scientific record rather than the intellectual property of the organizers. Sharing code and building on other contestant's models is encouraged in with hopes of forming networks of collaborative innovation.

Aside from lively competition, these challenges are a great way to compare the virtues of various methods on a standardized problem. Synapse is aiming to become an environment for hosting standard open data sets and documenting reproducible methods for deriving models from them.

Winning methods will be presented at the RECOMB/ISCB Conference in Toronto this fall.

So, if you want to sharpen your data science chops on some important open biological problems, check out the DREAM8 challenges.

More on DREAM, Sage Bionetworks, and Challenges

Sunday, February 24, 2013

Mapping phenotype to cell type

Last month, our journal club read Chromatin marks identify critical cell types for fine mapping complex trait variants which features authors representing several of the anchor stores in Boston's shopping mall of biotech (the Broad, Dana Farber, and Brigham and Women's).

I gather that the term chromatin marks means modifications to the histones and other DNA packaging molecules. I'm not sure if the term is also meant to include DNA modifications like methylation or the arrangement of DNA around the histones. In any case, these modifications form part of the eukaryotic regulatory system and data for them is becoming available from ENCODE and other sources.

The cool thing is, at heart, the paper is about a data transformation, specifically a join, a mapping across biological data types. GWAS data links variants at particular loci on the genome to phenotype, typically disease, with a genetic component. Chromatin marks are thought to play a major role in differentiation. Marks at specific loci are associated with cell type. So, now we have a mapping from disease-associated variants to cell type. To complete the loop, many diseases are already known to play out in specific cell types.

The circle could be navigated in either direction, using one type of information to corroborate another. Known affected cell types for a disease may be used to select weak GWAS hits that are likely to be causal or informative about the mechanisms at work. The same might be applied to cancer, maybe helping to guide the search for causal variants implicated in cancers of particular cell types.

The paper categorized GWAS hits associated with LDL cholesterol hyperlipidemia, arthritis, psychiatric disorders, and type-2 diabetes based on one chromatin mark, trimethylation of histone H3 at lysine 4 (H3K4me3), and found a nice enrichment for the expected cell types.

In bloody red are cell types with immune function, blue is brain tissue, yellow groups together adipose, musculoskeletal and endocrine cells, and GI cell types are in bilious green.

The Broad does a nice job of writing up the paper in their news section: Chromatin marks the spot in search for disease pathways.

Links

Monday, January 14, 2013

VCF: Variant Call Format

VCF, for Variant Call Format, is a tab delimited file format for storing genetic sequence variations developed in the context of the 1000 genomes project. There's a suite of open source vcftools and a pleasantly brief paper.

What follows serves as a dumping ground for knowledge and links about VCF.

VCF is a highly flexible format. There are 9 standard columns plus an additional column for each sample. The contents in the sample column are a colon-separated list of values. The FORMAT column specifies the layout of the sample columns, so that putting the two together yields a matching list of key/value pairs for each variant in each sample. A header section specifies metadata about the sample columns and the key/value properties.

A line of VCF is essentially a precomputed two-level join associating variants with samples and samples with key/value properties. On top of that, the INFO column associates key/value properties with the variant, so I suppose it's a 4-way join. Nice!

Terminology

Genotype: VCF handles genotypes of different ploidy. The genotype can contain just one allele (haploid), two alleles separated by one of '\', '|', '/' (diploid) or potentially more. Human VCF files will likely be mixed haploid and diploid due to the X and Y chromosomes in males and mitochondrial DNA.

Phasing: If the reference sequence assembly is reasonably complete, it may be possible to map the variant calls to a consistent strand. The term for this is phasing. A VCF file may be completely unphased or each call can indicate phased or unphased. The degree of completeness depends on how well and how unambiguously the calls map to the reference.

Filters: FILTER is one of the standard VCF columns. Valid values for FILTER column are "PASS" or a code for the filters that the variant call fails.

Tools

PyVCF is a nice python library for reading and writing VCF. It comes with a handy little utility vcf_filter, which does what it says. The reading part seems to be the most solid, with writing and filtering a little green, yet. But the code is nicely readable, and its proprietors are friendly to contributions.

SnpEff enhances VCF files by annotating variants and calculating the effects they produce on known genes, for example, amino acid changes, frame shifts and splice site changes.

VCF resources

Thursday, June 28, 2012

Institute for Systems Biology at Google I/O

The Shmulevich Lab scored a nice feature in the day 2 keynote at Google I/O. (See video starting at about 40:25 and again at 46:05.) Their work on the The Cancer Genome Atlas (TCGA) was part of the introduction of Google Compute Engine.

Ilya and Hector are quoted in the case study, Cancer Investigators Use Google Compute Engine to Accelerate Life-Saving Research.

The machine learning component is a random forest application called RF-ACE and the visualization is circvis. More Shmulevich lab code can be found at Code for Systems Biology.

Sunday, June 24, 2012

Data analysis workflow patterns

About a year ago, I ran a kooky idea past some colleagues. They gave it a big WTF, so I sat on it for a while. Not to be deterred, I still like the idea, so here it is.

Workflows are key to bioinformatics. For example, an analysis of gene expression might go something like the following. Measure gene expression using arrays or RNA-seq. After a bit of normalization, cluster genes by correlated expression. Then compute functional enrichment on the clusters. This helps get at questions about how the cell reacts to some stimulus. Whether that's nutrients, toxins, pH, sunlight, whatever. Or, what's the difference between a sick cell and a healthy one. The answer is in terms of processes or pathways up or down regulated.

You might implement our analysis of gene expression in R or Python. You could do it with point and click software like MeV and web tools like DAVID or workflow tools like Galaxy. You might use k-means, hierarchical clustering or something fancier. You might use GO terms to annotate gene function or KEGG pathways. There are lots of options, but the central idea is conserved.

The notion of a data analysis workflow is something like the concept of a software design pattern, an idea that software engineers borrowed from architects. A design pattern is a general reusable template for how to solve a commonly occurring problem. Naming and documenting a design pattern makes sharing knowledge easier and lets you talk and think at a higher level of abstraction.

Thinking of the workflow as an asset, it follows that they should be collected, documented and published. "In bioinformatics, we are familiar with the idea of curated data as a prerequisite for data integration. We neglect, often to our cost, the curation and cataloguing of the processes that we use to integrate and analyse our data." (Carol Goble et al. 2008) Both Taverna and Galaxy have mechanisms for doing this, albeit within the context of those tools. Maybe a better place to document workflows would be in journals. Philip Bourne, Editor in chief of PLOS Computational Biology says, "I want the publisher of the future to be the guardian of these workflows create a better scholarly record." He's speaking here of scientific workflows in a more general context than just data analysis.

Design patterns are documented in a specific format, detailing the scenarios in which that pattern applies, the intent behind it, its structure, implementation and consequences. Examples are usually given of real usages of the pattern along with discussion of alternatives or related patterns and its risks and pitfalls. For data analysis workflows, we'd probably want to discuss possible sources of error, required conditions and statistical properties.

This is not to say we need formalism for the sake of formalism. It's tempting to get caught up with impractical methodological hoo-ha, focusing on process to the exclusion of real and practical goals. A workflow should be a tool in a researcher's toolbox, a pragmatic way to package a bite-sized piece of knowledge. To be avoided is the over-abstraction and questionable utility that some (i.e. me) see in BPEL, BPM, MDA and related (increasingly defunct) technology trends.

Rather than design patterns, maybe a more biologist-friendly term is a protocol. Plus, there's already a long history of journals dedicated to lab protocols. Why not do the same for protocols for data analysis?

More

Like every idea, good or crackpot, people have thought of this one before me.

Sunday, June 10, 2012

Scientific imaging with Hanchuan Peng

Hanchuan Peng of Janelia Farm spoke on bioimaging at ISB a couple weeks back. He's doing some very cool work mining microscopy images doing registration - aligning individual cells across images. They've created a 3D atlas of C. elegans which tracks every cell. The still pictures don't don't do it justice. Check out the movies.

By localizing and registering neural fibers in 2,954 fly brains, Peng's group constructing this wiring diagram of the fly's 100,000 neurons.

More

Wednesday, May 02, 2012

Phenotypic constraints drive the architecture of biological networks

Biological networks are often compared to random networks in terms of properties like degree distribution, clustering, robustness and over-representation of network motifs. In a talk this morning, Areejit Samal, a Postdoctoral Fellow in the Price lab at ISB, proposed a new null model based on Markov Chain Monte Carlo (MCMC) sampling to generate realistic benchmark ensembles for metabolic networks and gene regulatory networks. Based on this improved background model, the conclusion is that “phenotypic constraints drive the architecture of biological networks”, which is also the title of the talk.

Applied to the metabolic model of E. coli, the sampling technique involves two steps. In the swap step, a reaction is removed from the network and a new reaction is drawn randomly from the KEGG database to replace it. The proposed new network is then tested by flux-balance analysis. If the new network is viable, it is accepted. If not, it is rejected. So, only networks that are biochemically plausible are sampled.

The technique has implications for systems and synthetic biology as well as evolutionary theory. By approximating the space of all possible networks that might lead to a viable functioning organism, we can better understand what properties these networks have, and maybe better design new networks. By changing the acceptance criteria to enforce viability in a second environment, the algorithm nicely models the evolutionary emergence of modularity.

Samal also showed the same general algorithm applied to the gene regulatory network controlling flowering in Arabidopsis.

I especially appreciated seeing a really cool application of Markov Chain Monte Carlo sampling, a topic covered only a couple weeks back in the Probabilistic Graphical Models class.

Links

Friday, April 27, 2012

Sage Bionetworks Synapse

Michael Kellen, Director of Technology at Sage Bionetworks, is trying to build a GitHub for science. It's called Synapse and Kellen described it in a talk at the Sage Bionetworks Commons Congress 2012, this past weekend: 'Synapse' Pilot for Building an 'Information Commons'.

To paraphrase a Kellen's intro:

Science works better when people build off of each other's works. Every great advance is preceded by a multitude of smaller advances. It's no accident that the invention of the printing press and the emergence of the first scientific journals coincide with the many great scientific discoveries of the age of enlightenment. But scientific journals are stuck in a paradigm revolving around the printing press. In other domains, namely open source software, people are more radically reinventing systems for sharing information with each other. Github is a collaborative environment for the domain of software. Synapse aims to be a similar environment for medical and genomic research.

The Synapse concept of a project packages together data and the code to process it. I tried to download the R script shown in the contents and couldn't, either because I'm a knucklehead or because Synapse is a work in progress. On the plus side, they give you a helpful cut-n-paste snippet of R code in the lower right corner to access the project through their R API. When this is fully implemented, it could provide a key piece of computing infrastructure for reproducible data-driven science.

Sage intends to explore ways of connecting to traditional scientific journals. Picture figures that link to interactive visualizations or computational methods that link to code. I'm a big fan of the "live document" concept and it would be great to see journal articles evolve in that direction.

An unintended consequence of NGS, Robert Gentleman points out, is that the data is too big for existing pipes. Any concept of a GitHub for science will have to incorporate processing biological data in the cloud. I could imagine a Synapse project containing data sets, code and a recipe for standing up an EC2 instance (or several). At a click, a scripted process would run, bootstrapping the machines, installing software and dependencies, running a processing pipeline, and visualizing the results in a browser. How would that be for reproducible science?

Michael Kellen's blog has a bunch of interesting stuff about why building a GitHub for biology is more fun than selling sheets. I bet it is.

Friday, March 23, 2012

Applying Semantic Web Services to bioinformatics

Applying Semantic Web Services to bioinformatics: Experiences gained, lessons learnt
Phillip Lord, Sean Bechhofer, Mark D. Wilkinson, Gary Schiltz, Damian Gessler, Duncan Hull, Carole Goble, and Lincoln Stein
International Semantic Web Conference, Vol. 3298 (2004), pp. 350-364, doi:10.1007/b102467

Applying Semantic Web Services to bioinformatics is a 2004 paper on Semantic Web Services in context of bioinformatics, based on the experiences of the myGrid and BioMoby projects. The important and worthy goal behind these projects is enabling composition and interoperability of heterogeneous software. Is Semantic Web technology the answer to data integration in biology? I'm a little skeptical.

Here's a biased selection of what the paper has to say:

  • "The importance of fully automated service discovery and composition is an open question. It is unclear whether it is either possible or desirable, for all services, in this domain..."
  • "Requiring service providers and consumers to re-structure their data in a new formalism for external integration is also inappropriate."
  • "Bioinformaticians are just not structuring their data in XML schema, because it provides little value to them."
  • "All three projects have accepted that much of the data that they receive will not be structured in a standard way. The obvious corollary of this is that without restructuring, the information will be largely opaque to the service layer."

A couple of interesting asides are addressed:

  • Most services or operations can be described in terms in inputs and outputs and configuration parameters or secondary input. When building a pipeline, only main input and output need be considered, leaving parameters for later.
  • A mixed a user base divided between biologists and bioinformaticians is one difficulty noted in the paper. I've also found that tricky. Actually, the situation has changed since the article was written. Point-and-click biologists are getting to be an endangered species. The crop of biologists I see coming up these days is very computationally savvy. What I think of as the scripting-enabled biologist is a lot more common. Those not so enabled are increasingly likely to specialize in wet-lab work and do little or no data analysis.

In BioMOBY Successfully Integrates Distributed Heterogeneous Bioinformatics Web Services. The PlaNet Exemplar Case, (2005) Wilkinson writes,

...interoperability in the domain of bioinformatics is, unexpectedly, largely a syntactic rather than a semantic problem. That is to say, interoperability between bioinformatics Web Services can be largely achieved simply by specifying the data structures being passed between the services (syntax) even without rich specification of what those data structures mean (semantics).

In The Life Sciences Semantic Web is Full of Creeps!, (2006) Wilkinson and co-author Benjamin M. Good write, "both sociological and technological barriers are acting to inhibit widespread adoption of SW technologies," and acknowledge the complexity and high curatorial burden.

The Semantic Web for the Life Sciences (SWLS), when realized, will dramatically improve our ability to conduct bioinformatics analyses... The ultimate goal of the SWLS is not to create many separate, non-interacting data warehouses (as we already can), but rather to create a single, ‘crawlable’ and ‘queriable’ web of biological data and knowledge... This vision is currently being delayed by the timid and partial creep of semantic technologies and standards into the resources provided by the life sciences community.

These days, Mark Wilkinson is working on SADI, which “defines an open set of best-practices and conventions, within the spectrum of existing standards, that allow for a high degree of semantic discoverability and interoperability”.

More on the Semantic Web

...looks like this old argument is still playing out.

Tuesday, March 20, 2012

Finding the right questions

A 2010 PLOS Biology article, Finding the right questions: exploratory pathway analysis to enhance biological discovery in large datasets, makes some good points about exploratory analysis of noisy biological data and the design of software to help do it.

At a time when biological data are increasingly digital and thus amenable to computationally driven statistical analysis, it is easy to lose sight of the important role of data exploration. Succinctly defined over 30 years ago by John Tukey, exploratory data analysis is an approach to data analysis that focuses on finding the right question, rather than the right answer. In contrast to confirmatory analysis, which involves testing preconceived hypothesis, exploratory data analysis involves a broad investigation, a key component of which may be visual display. Though his arguments predate personal computing and thus focus on graph paper and ink, the point still stands: good data visualization leads to simpler (better) descriptions and underlying fundamental concepts. Today, there is tremendous potential for computational biologists, bioinformaticians, and related software developers to shape and direct scientific discovery by designing data visualization tools that facilitate exploratory analysis and fuel the cycle of ideas and experiments that gets refined into well-formed hypotheses, robust analyses, and confident results.

The authors are involved in Wikipathways, an open platform for curation of biological pathways comparable to KEGG and Ingenuity Pathway Analysis, MetaCyc, and Pathway Commons, and this provides the context for their comments. But, most of their conclusions apply more generally to software for research, where the goal is to enable “researchers to take a flexible, exploratory attitude and facilitate construction of an understandable biological story from complex data.”

...instead of aiming for a single, isolated software package, developers should implement flexible solutions that can be integrated in a larger toolbox [...], in which each tool provides a different perspective on the dataset.
For developers, realizing that exploratory pathway analysis tools might be used not only in isolation but also with other software and different types of data in a flexible analysis setup might guide software design and implementation.

Effective data integration

Flexibility and interactivity are keys to effectiveness. “Determining what to integrate and how to present it to the user depends on the context and the question being asked.” Researchers often need to follow up on a weak or uncertain signal by finding confirmatory evidence in relevant orthogonal or correlated datasets. This emphasizes the importance of well curated data, whether pathways or annotated genome assembies, which can form the scaffolding on which integration takes place.

Providing an API, in addition to UI, opens up possibilities for scripting and automation and enables advanced users to “combine functionalities of different tools to perform novel types of analysis.” The authors note that defining general data models increases reusability and unity among software tools. This resonates with my own experience. One of the key virtues of Gaggle is it's highly general data model consisting of basic data structures - list, matrix, network, table, and tuples - free of specific semantics.

Also noted are the difficulties which make current analysis tools “rather isolated and hard to combine”, specifically:

  • reformatting data
  • mapping identifiers
  • learning curve of multiple software packages

“Succinctly defined over 30 years ago by John Tukey, exploratory data analysis is an approach to data analysis that focuses on finding the right question, rather than the right answer.” We've not yet found the right answer for data integration for biology, but it's clear that “integration of annotations and data is critical to extracting the full potential from large and high-throughput datasets.” This paper contains some exceptionally clear thinking on building software tools that will help bring that about.

Citation

Kelder T, Conklin BR, Evelo CT, Pico AR (2010) Finding the Right Questions: Exploratory Pathway Analysis to Enhance Biological Discovery in Large Datasets. PLoS Biol 8(8): e1000472. doi:10.1371/journal.pbio.1000472

Tuesday, March 06, 2012

Ingenuity

When I was a little whelp, I had a brief and unsuccessful engagement at a bioinformatics startup in the bay area called Ingenuity. The company had a cool idea, a knowledge base for molecular biology, and smart and creative people to implement it. I was tasked, by a long-haired, Tufte-toting, Stanford grad-student, with developing new and rich UI elements with the budding new technology at the time, dynamic HTML. In particular, I was to implement a search bar that could automatically suggest terms from an ontology - the autocomplete feature.

There was even a prototype that sort-of worked on the right version of Netscape when the server 30 feet away. I pulled my hair out trying to get it working consistently across browsers. A better engineer, say John Resig, might have pulled it off, but I had to admit defeat. Like many DHTML toys of the time, it just wasn't ready for production. So, I recommended scrapping the idea in favor of a simple "google-box". This was not well received and my tenure was not long in coming to a close.

For years after, I'd argue on every project for simple, stripped-down web UIs. "Look at Google," I'd say, pointing to the minimalist search box. Trying to do anything advanced in a browser, I'd warn, was an invitation to cross-browser compatibility issues and nightmarish debugging sessions.

Meanwhile, as if to make me look like a bozo (as if I need any help), Google introduced autocomplete, AKA Google Suggest, first as a Google Labs project, in 2004 and finally rolled out autocomplete on the main Google page in 2008. So much for my "Look at Google" argument. Not that it matters now, but I feel slightly vindicated by the fact that it took even the mighty Google this long to deploy a feature that I was basically shit-canned for failing to implement in 2000. ...not that I'm bitter. But, anyway, back in the present day...

Doug Basset, Chief Scientific Officer at Ingenuity gave a demo last week at the ISB, where I now reside, showing off Ingenuity Variant Analysis, a new tool built on top of their knowledge base that helps find disease-causing genetic variations in resequencing data.

The basic trick is to filter down the millions of genetic variants found in any individual genome to those consistent with a given condition, starting with it's frequency in the population and genetic properties like homo- or heterozygosity. The neat part comes next.

For each variant surviving this far, the program traverses the graph of facts in the knowledge base. Of course, it will find known associations between variants or their host genes and disease. What's better, it can also find relationships a few degrees removed from direct implication. Say, A turns off B with regulates C. The biological process to which C belongs runs amok in disease X. Suddenly, a variant in a functional domain of gene A looks like an interesting candidate. If it works, you end up with a handful of genes with enough evidence to warrant further investigation.

The products's flash-based UI is very slick and modern, with drop-shadows, ghosting and barber-pole progress bars. Tables have spiffy little sparkline graphics. Right in the middle of the demo, a search dialog popped up and there was the autocomplete feature, mocking me. It's certainly no big deal these days. My current project has an autocompleting search box, too, thanks to jQuery and Solr. But, I guess the memory of flubbing that gig still has a little sting left in it.

Wednesday, December 14, 2011

SDCube and hybrid data storage

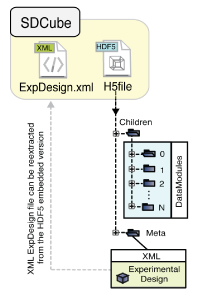
The Sorger lab at Harvard published a piece in the February 2011 Nature Methods that shows some really clear thinking on the topic of designing data storage for biological data. That paper, Adaptive informatics for multifactorial and high-content biological data, Millard et al., introduces a storage system called SDCubes, short for semantically typed data hypercubes, which boils down to HDF5 plus XML. The software is hosted semanticbiology.com.

This two part strategy applies HDF5 to store high-dimensional numeric data efficiently, while storing sufficient metadata in XML to reconstruct the design of the experiment. This is smart, because with modern data acquisition technology, you're often dealing with volumes of data where attention to efficiency is required. But, experimental design, the place where creativity directly intersects with science, is a rapidly moving target. The only hope of capturing that kind of data is a flexible semi-structured representation.

This approach is very reminiscent, if a bit more sophisticated, than something that was tried in the Baliga lab called EMI-ML, which was roughly along the same lines except that the numeric data was stored in tab-separated text files rather than HDF5. Or to put it another way, TSV + XML instead of HDF5 + XML.

Another ISB effort, Addama (Adaptive Data Management) started as a ReSTful API over a content management system and has evolved into a ReSTful service layer providing authentication and search and enabling access to underlying CMS, SQL databases, and data analysis services. Addama has ambitions beyond data management, but shares with SDCube the emphasis on adaptability to the unpredictable requirements inherent in research by enabling software to reflect the design of individual experiments.

There's something to be said for these hybrid approaches. Once you start looking, you see a similar pattern in lots of places.

  • NoSQL - SQL hybrids
  • SQL - XML hybrids. SQL-Server, for one, has great support for XML enabling XQuery and XPath mixed with SQL.
  • Search engines, like Solr, are typically used next to an existing database
  • Key/value tables in a database (aka Entity–attribute–value)

Combining structured and semi-structured data allows room for flexibility where you need it, while retaining RDBMS performance where it fits. Using HDF5 adapts the pattern for scientific applications working with vectors and matrices, structures not well served by either relational or hierarchical models. Where does that leave us in biology with our networks?. I don't know whether HDF5 can store graphs. Maybe we need a triple hybrid relational-matrix-graph database.

By the way, HDF5 libraries exist for several languages. SDCube is in Java. MATLAB can read HDF5. There is an HDF5 package for R, but it seems incomplete.

Relational databases work extremely well for some things. But, flexibility has never been their strong point. They've been optimized for 40 years, but shaped by the transaction processing problems they were designed to solve, and they just get awkward for certain uses, to name some - graphs, matrices and frequently changing schemas.

Maybe, before too long the big database vendors go multi-paradigm and we'll see matrices, graphs, key-value pairs, XML and JSON as native data structures that can be sliced and diced and joined at will right along with tables.

More information

  • Quantitative data: learning to share, an essay by Monya Baker in Nature Methods, describes how "Adaptive technologies are helping researchers combine and organize experimental results."

Friday, September 23, 2011

Network Science

Network analysis is hip. Applications range over social networks, security, biology, and economics. At this point, you'll hardly be the first one to the party, but if you want to give network science a try, here's a random grab-bag of resources to get started.

Coordination of frontline defense mechanisms under severe oxidative stress, Kaur et al. 2010

Learning network science

Jon Kleinberg, a professor of computer science at Cornell University, co-wrote Networks, Crowds, and Markets: Reasoning About a Highly Connected World along with David Easley. He also wrote Algorithm Design, an undergraduate textbook.

A 2004 review paper by Barabasi and Oltvai Network biology: understanding the cell's functional organization. covers a broad range of applications of networks in modern biology. Barabasi is also author of Linked.

A Science special issue on networks, from July 2009, revisits the foundations of network analysis, and delves into applications to ecological interactions, counter-terrorism, and finance.

Video and slides are available for Drew Conway's presentation on social network analysis in R, which mostly focuses on software tools.

Tools for analyzing networks

Software tools for working with networks include the R packages graph, igraph, network. Also, the NetworkX library for Python looks quite powerful. Visualization tools tend to come and go, but some well-known tools are: Cytoscape, Gephi, and GraphViz.

More network stuff

Monday, September 19, 2011

Applying control theory to the cell

In a talk about research goals in the systems biology of microbes, Adam Arkin referenced the Internal Model Principle of control theory. Here are a couple definitions.

A regulator for which both internal stability and output regulation are structurally stable properties must utilize feedback of the regulated variable and incorporate in the feedback loop a suitably reduplicated model of the dynamic structure of the exogenous signals which the regulator is required to process.

Towards an Abstract Internal Model Principle Wonham, 1976

That's a mouthful. This one's a little less scary.

Internal Model Principle: control can be achieved only if the control system encapsulates, either implicitly or explicitly, some representation of the process to be controlled.

Lecture notes on Introduction to Robust Control by Ming T. Tham, 2002

Driving this thinking is the discovery that microbes show anticipatory behavior and the associations can be fairly readily entrained and lost in a few generations. Ilias Tagkopoulos and Saeed Tavazoie, in Predictive behavior within microbial genetic networks, demonstrated associative learning through rewiring gene regulatory networks. It turns out that when E. coli senses a shift to mammalian body temperature, it begins the transition to anaerobic metabolism, nicely anticipating the correlated structure of it's environment.

In another example, Amir Mitchell working at Weizmann, showed that yeast anticipates the stages of fermentation in Adaptive prediction of environmental changes by microorganism.

This raises some important questions. How is the internal model encoded within the cell? And how does the cell acquire, parameterize and adjust its internal model over evolutionary time scales? The answers will lead to a deeper understanding of living systems and might even feed new techniques and principles back to control theory.

An interesting challenge will be to experimentally read out the information embedded in the cell's control systems and then the informatics problem of how to represent and work with such things.

Understanding how this works is a prerequisite for re-engineering living systems, otherwise known as synthetic biology, championed by George Church and Drew Endy. This month, by the way, the journal Science has a special issue on synthetic biology.

I'm fascinated by the idea of applying engineering principles to biology - evolved systems, rather than engineered artifacts. Maybe that's because my spaghetti code looks a lot like the messy interconnectedness of biology. Creating software feels organic, rather than wholly predesigned. The engineering of complex software systems tends to be an adaptive evolutionary process. As messy as biology is, modularity naturally emerges. Maybe biology has something to teach us about organizing this chaos.

Wednesday, August 03, 2011

Microarrays

Microarrays are one of the workhorses of modern biology. Measuring transcript levels enables studies of differential expression - asking what the difference is, at the gene expression level, for example, between cancer tumor cells and normal cells.

Bruz Marzolf, who up 'til recently ran my local microarray facility, spoke recently, tracing the journey of microarrays through the full technology life-cycle, starting in 1995 with the publication of Quantitative Monitoring of Gene Expression Patterns with a Complementary DNA Microarray in Science. Bruz put microarrays in the category of a utility technology, but not quite to the point of commoditization as there remain major differences between manufacturers.

  • Affymetrix, first to commercialize microarray technologies, is the 800 pound gorilla. Their photolithography process borrows from computer chip manufacturing and their standardized probe sets are well supported by tools such as Bioconductor. The technology is robust but producing the masks is quite expensive, thus custom arrays are not economical.
  • Agilent, which spun out of HP, uses ink-jet technology. Custom arrays can be designed using Agilent's eArray software. Agilent arrays come in a variety of resolutions including 8x60k, 1x244k and 1x1m with 60mer probes.
  • Illumina builds arrays out of beads coated in oligo probes. Beads are laid out randomly on the slides, necessitating a layout discovery step. These chips have extra redundancy to account for randomness in bead-probe count.
  • Nimblegen's maskless photolithography process is more flexible for custom arrays. Nimblegen provides arrays in 385K, 4x72K, and 12x135K resolutions using 60mer probes. They emphasize high array-to-array data reproducibility.

As an aside, our group uses custom spotted arrays and Agilent arrays. We tried Nimblegen and found that inter-array consistency was excellent, but inter-probe consistency was not. Below we see the ribosomal RNAs and adjacent genes with total RNA measured by a custom Agilent array (in blue) plotted next to a custom Nimblegen array (in green). To be fair there might be other explanations for what we saw, but it certainly looks like there is significant variability between probes that we would expect to have identical readings.

In RNA-Seq: a revolutionary tool for transcriptomics (Nature Reviews Genetics, 2009), Zhong Wang, Mark Gerstein & Michael Snyder show this comparison between microarrays and RNA-Seq.

While RNA-seq, no doubt, has a higher dynamic range, does it really have less noise? Some folks say so. With tens or hundreds of thousands of probes, fairly dense coverage of whole microbial genomes is possible. If you know what you're looking for, microarrays are still cheaper. Discovery oriented work is going increasingly toward sequencing.

Links

Monday, June 06, 2011

Primers in Computational Biology

Nature Biotechnology used to regularly feature primers on various topics in computational biology. Here's an incomplete listing based on what looked interesting to me. Some of these are old, but on topics that are fundamental enough not to go out of style. Lot's of these are just mini-tutorials in machine learning.

...just in case you're in need of some bed-time reading or some mad comp-bio skillz. Sorry if some of these are behind a pay-wall, but there's usually a way around, under or over such walls.

Thursday, April 21, 2011

Genome Browser's Anonymous

As you may know, I'm starting a support group for those afflicted with the tragedy of having written a genome browser. Mine is called the Gaggle Genome Browser. About the time I was writing it, everyone and their uncle's dog decided to write a genome browser. New instruments with new data types were coming into the lab. Computers had more memory and CPU cores than ever. It seemed like a good idea at the time.

The Broad Institute's Integrative genomics viewer (shown below) got a write-up in the January Nature Biotechnology. IGV seems particularly well developed for next-gen sequencing data, nicely displaying coverage plots and alignments of short reads, with attention to the nuances of paired-ends.

IGV is a Java desktop app that pulls data down from a server component, the IGV Data Server. In my case, I cooked up a two level hierarchy for caching chunks of data in memory backed by SQLite. It's probably smart to add a server as a third level. IGV's multi-resolution data mode precomputes aggregations for zoomed-out views in which data is denser than the pixels in which to display it. IGV splits data into "tiles" stored in a custom indexed binary file format. "Hence a single tile at the lowest resolution, which spans the entire genome, has the same memory footprint as a tile at the very high zoom levels, which might span only a few kilobases." My GGB aggregates on the fly, which hurts performance in zoomed out views.

The IGV Data Server seems to derive a lot of it's data from the UCSC Genome Browser, which maintains nicely curated data mapped to genomic coordinates for a bunch of eukaryotes and also microbes. One thing I enjoyed hacking with on GGB was integration with R. I wonder if that would be worthwhile for IGV.

Which functionality to put on the client vs. which in the server is debatable. We considered building a browser based implementation, experimenting a bit with the super-cool protovis visualization library. We went with desktop. X:map is a nice counter-point, an interactive web-based genome browser. In their approach, the Google Maps API serves up pre-rendered image tiles, keeping the big data and heavy-weight computing tasks on the server. They also have an R and Java program that lets you plot custom data. JBrowse, from CSHL, does the rendering in the browser. Putting a data intensive and graphically interactive app in the browser is still somewhere near the edge of the envelope, but browsers are improving like crazy, as are programming models for this type of development.

For what it's worth, I like the format of the IGV paper. It concisely covers motivation, what the software does, a few unique features and a couple figures showing example applications, all at a high level overview in just two pages. A supplement contains the technical detail of interest to software developers along with more example applications. I like that better than trying to awkwardly shoehorn biology and software engineering together.

Anyway... Nice work, IGV team! Let me know if you'd like to join the support group. We're here to help.